










Kubernetes adoption continues to grow as enterprises increasingly rely on containerized environments to deploy and scale their application. However, the complexity of the Kubernetes environment has evolved dramatically. It ranges from single-cluster setups of workloads to multi-cluster environments spanning hybrid and multi-cloud infrastructure. Kubernetes deployments are now characterized by their scale and diversity. Further multi-tenancy within a single cluster is becoming standard practice, as seen with the accelerated adoption of managed Kubernetes services available with Microsoft AKS, Amazon EKS, and Google GKE, further complicating the tenant and their workload security.
Organizations are leveraging Kubernetes to manage thousands of workloads within a single cluster and distribute them across multiple clusters for redundancy, geographic coverage, and performance optimization. Additionally, hybrid and multi-cloud deployments allow businesses to balance cost, performance, and compliance requirements.
To manage and secure this growth, organizations must ensure robust network security while maintaining visibility and simplifying operations. Addressing these challenges requires a comprehensive understanding of Kubernetes traffic patterns and the solution to observe, aggregate, and correlate traffic data.
Challenges
Kubernetes environments generate various traffic patterns, including:
- In-cluster traffic: Communication between pods within the same cluster
- Egress traffic: Outbound traffic to external services or the internet
- DNS traffic: Application layer traffic for external services
- Cross-cluster traffic: Communication between services hosted in different clusters
- Ingress traffic: External requests entering the cluster
Each type of traffic introduces unique challenges in terms of visibility, monitoring, and control. Organizations often rely on different tools for all such kinds of traffic, leading to operational inefficiencies and collecting all types of non-required traffic data. Storing, aggregating, and correlating traffic data becomes an expensive operational overhead.
For daily operations, organizations encounter several challenges with multiple traditional tools:
- Lack of Visibility: Traditional tools struggle to provide real-time insights as a single correlated view of workload communications, network flows, and application behaviors within dynamic workloads running in Kubernetes clusters.
- Troubleshooting Complexity: In multi-region or large-scale deployments, identifying issues like latency or connectivity errors becomes increasingly difficult.
- Security Posture Gaps: Identify compliance risks and security vulnerabilities due to Kubernetes’ default open communication model across pods.
- Operational Complexity: Managing different aspects of networking and network policies across multiple teams and clusters with multiple tools without a structured approach can result in conflicts and inefficiencies.
In summary, with multiple monitoring tools in play, a lack of precise visibility can create blind spots while troubleshooting complexity increases with multi-region deployments. Moreover, compliance risks and operational inefficiencies arise due to Kubernetes’ default open communication model and unmanaged policy configurations.
Implication
When operating thousands of workloads, hundreds of nodes, and tens of clusters, these challenges at scale can lead to significant risks. From an observability perspective, Kubernetes environments are challenging to troubleshoot as they contribute more variables, leading to complexity. Applications running on Kubernetes platforms continually change IP addresses and locations, making using traditional log flows to debug issues and investigate anomalous activity challenging.
- Infrastructure is dynamic, with pods continually being created and destroyed
- Infrastructure is distributed, with data stores residing on disparate pieces of infrastructure, on-prem and cloud
- Applications are distributed and dynamic, with microservices making API calls to each other
The combination of these variables makes it impossible for developers, platform owners, DevOps to debug platform, application communication, and performance issues for both. For example:
- Why isn’t my application working?
- How many tenants are in my cluster? How is their performance?
- Are there security gaps within clusters for different services or applications?
- Is my cluster compliant? Are my workloads compliant?
- Why is the performance weak and inconsistent?
- Where is the application breaking and slowing down?
Today, the platform, DevOps, or developer must take log data from different parts of their distributed infrastructure and manually piece together enough information to understand the problem. This is a next-to-impossible task, given the amount of data they need to capture and the time required. The result is delayed roll-outs of new applications, which can have a negative impact on the business. Identifying the 2% of relevant data that holds critical insights requires smart aggregation and correlation mechanisms from various logging systems. This leads to the following scenarios:
- Increased Attack Surface: Malicious actors can exploit vulnerabilities without proper real-time visibility and fast-to-action controls, leading to potential data breaches.
- Operational Delays: Complex troubleshooting processes involving multiple stakeholders, including application developers, DevOps, and platform teams, can cause prolonged downtime, affecting service availability and user trust.
- Compliance Violations: Inadequate security and compliance measures on continual basis may result in non-compliance with industry regulations such as PCI v4.0, HIPAA, SOC 2, GDPR, and ISO 27001, leading to legal penalties and business disruptions.
- Resource Drain: Operational inefficiencies divert valuable resources, hindering innovation and growth.
Resolution
Calico addresses these challenges with a broad portfolio of capabilities tailored to containerized workloads and scalable Kubernetes environments.
1. Enhanced Visibility
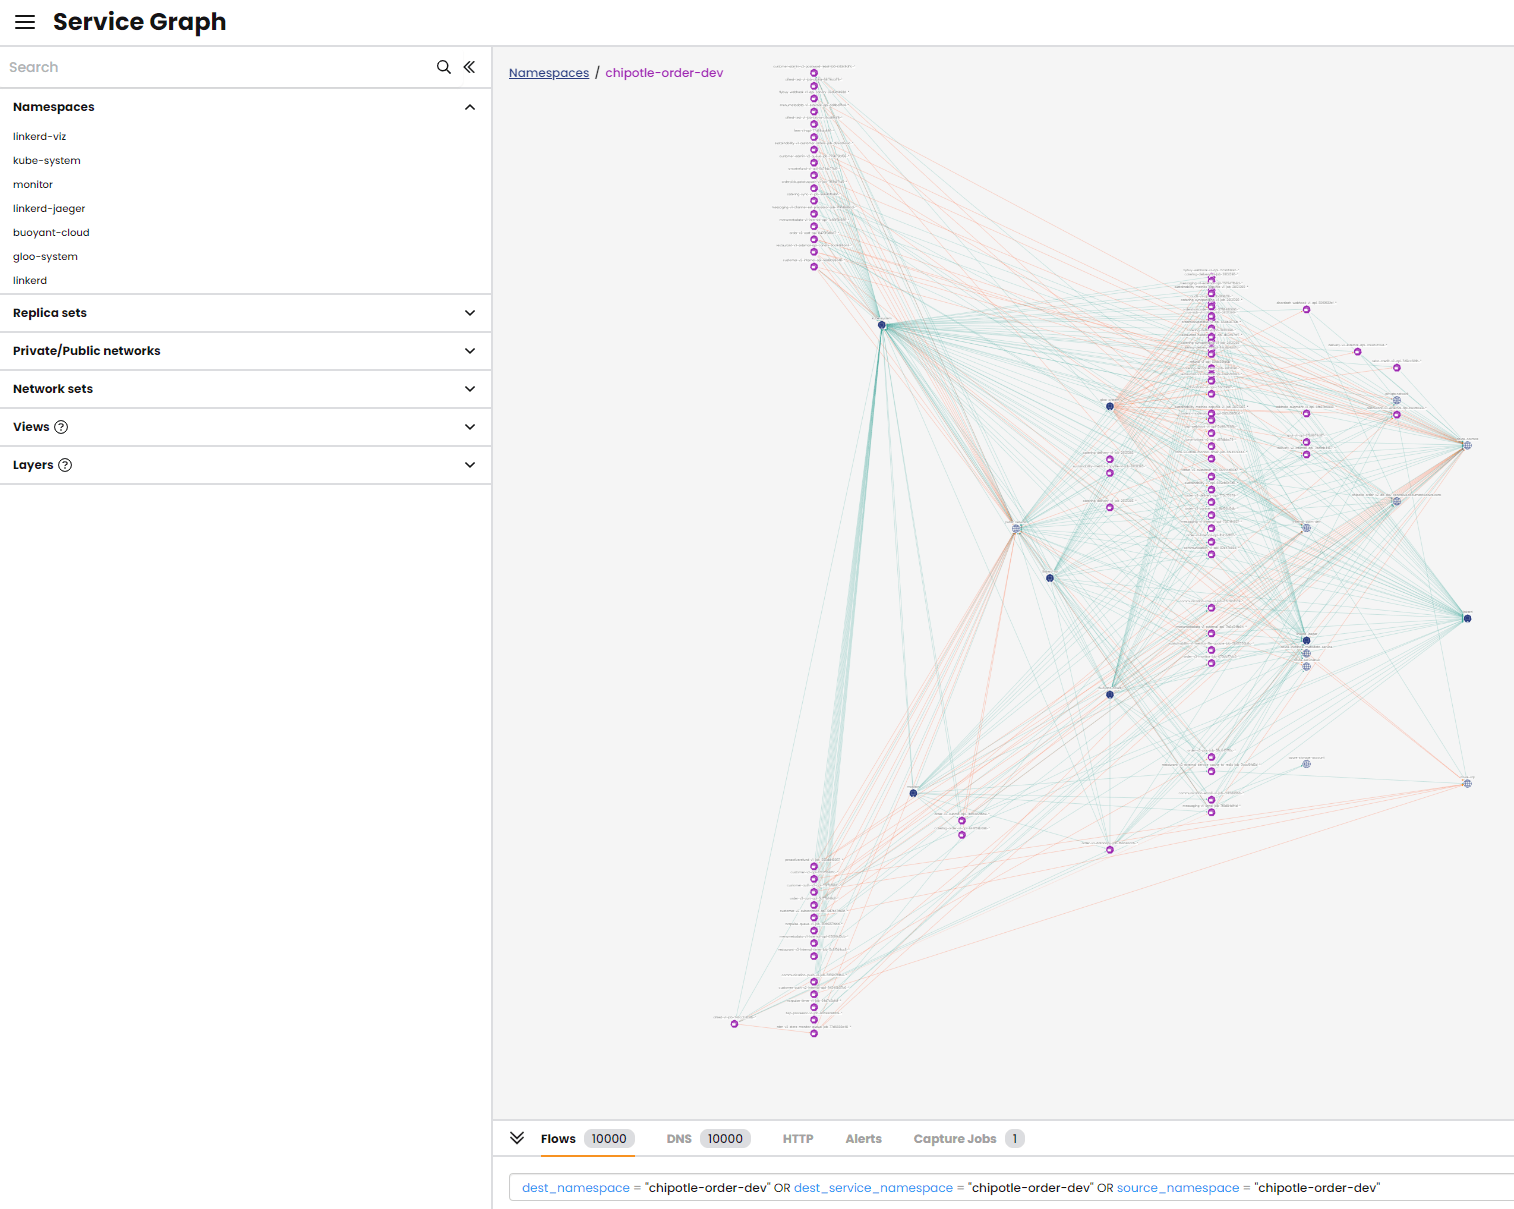
- Dynamic Service and Threat Graph: Provides a real-time, pod-level visualization of network traffic, service interactions, and DNS activity, enabling comprehensive monitoring and security enforcement.
- Flow Logs: Offer detailed records of network flows enriched with Kubernetes metadata, all networking layers, labels, and tags, facilitating efficient troubleshooting and analysis.
- DNS Latency Monitoring: Ensures optimal application performance by monitoring and alerting on DNS resolution times.
Example: A microservices application experiences latency issues. Using Calico’s Dynamic Service and Threat Graph, the team quickly identifies a misconfigured service causing the delay and resolves the issue promptly.
2. Simplified Troubleshooting
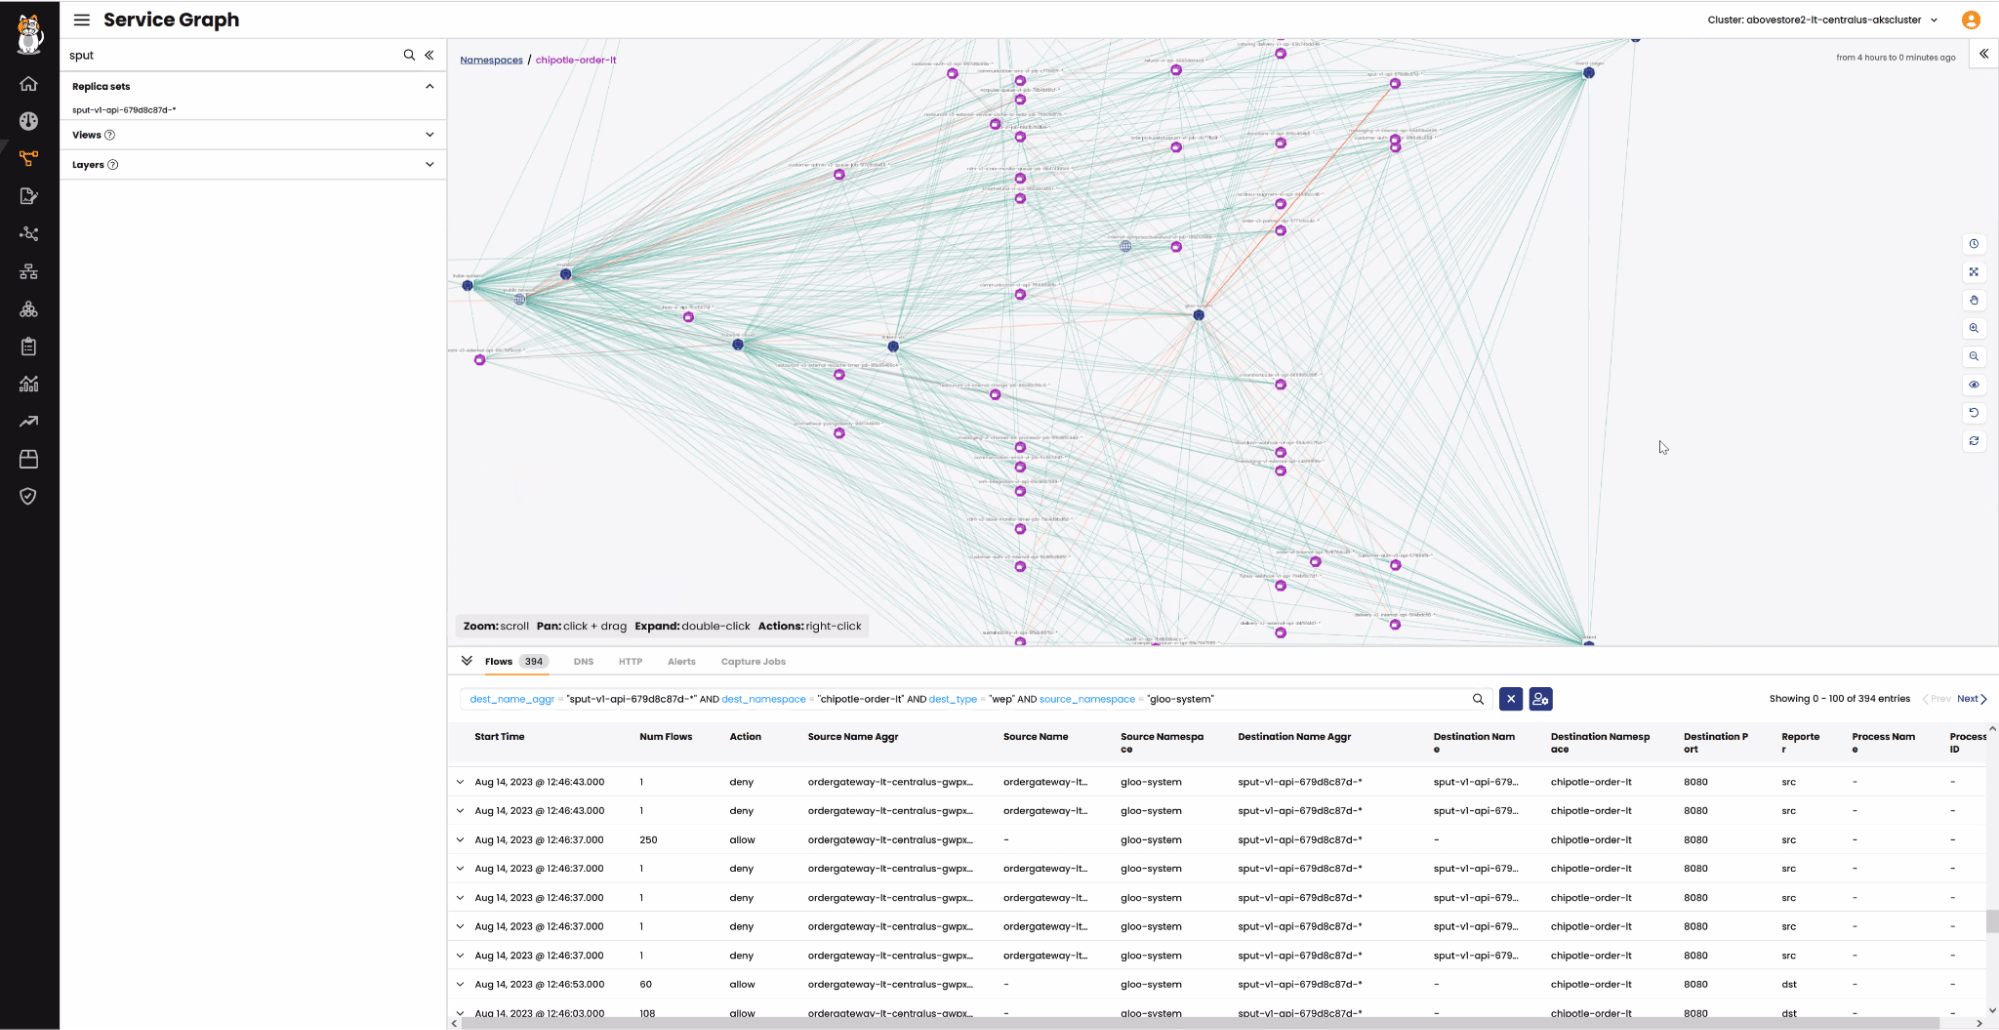
- Dynamic Packet Capture: Allows targeted packet captures at the pod, namespace, or service level, streamlining the debugging process.
- Flow Log Filters: Enable filtering by actions (e.g., “deny”) or specific attributes, aiding in pinpointing issues.
Example: In a multi-region deployment, a team uses Calico’s packet capture to efficiently diagnose and resolve a cross-cluster connectivity problem.
3. Robust Security Posture
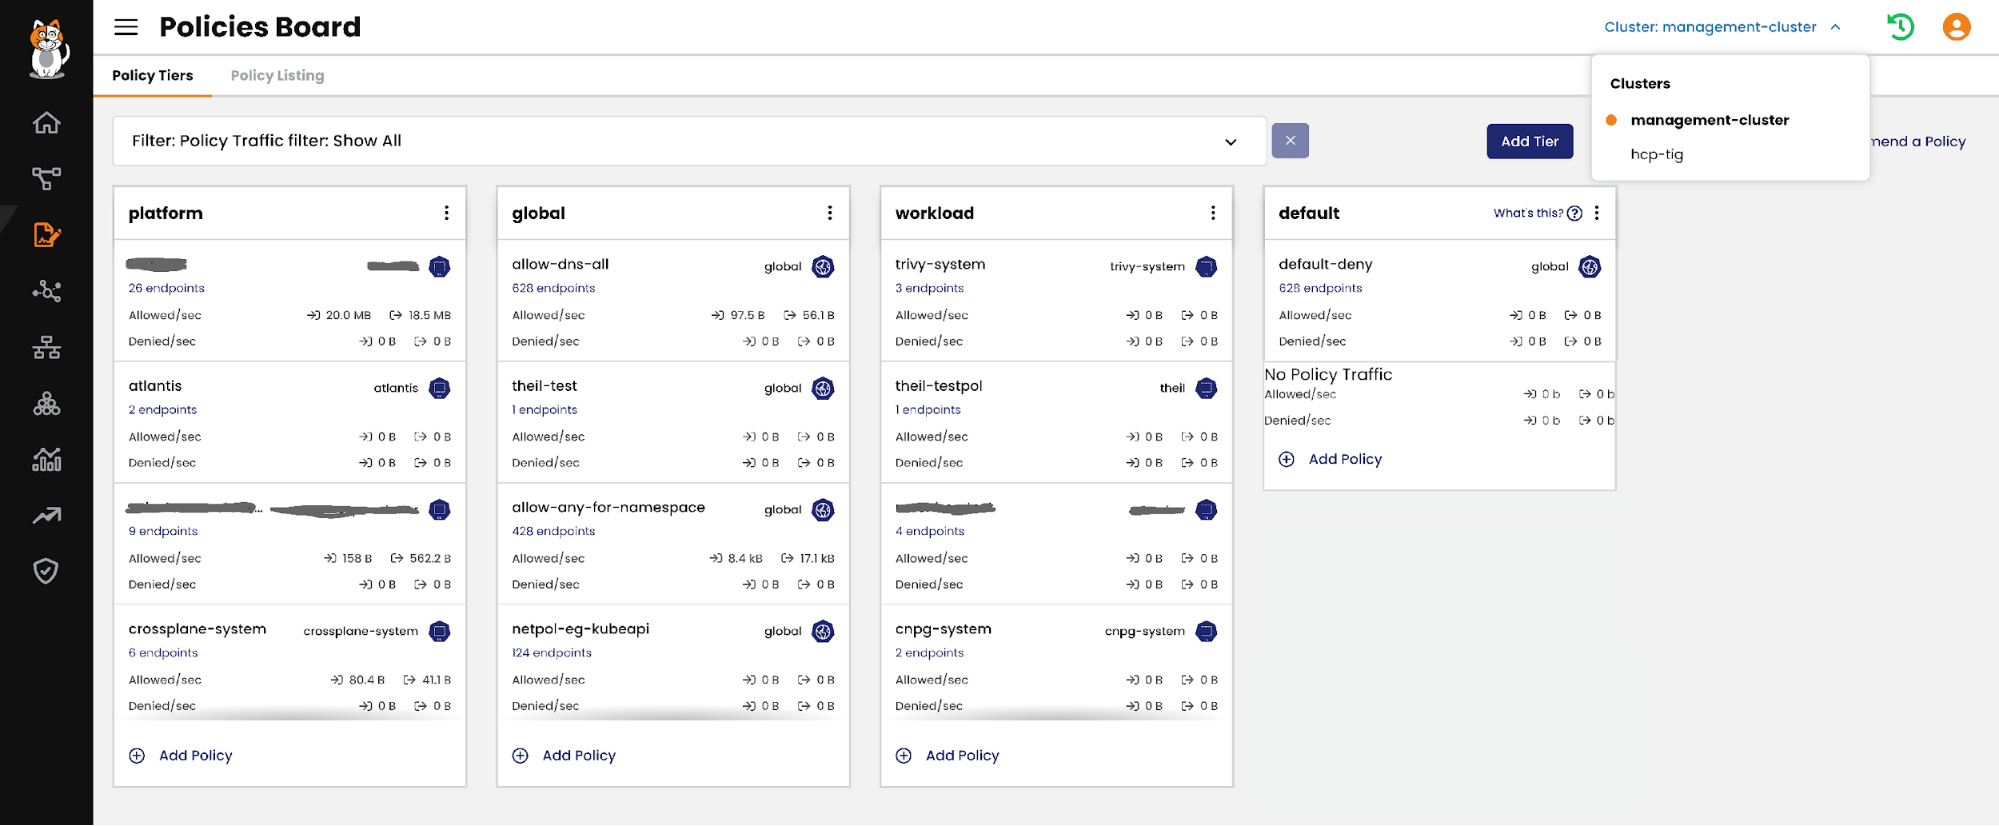
- Hierarchical Policy Model: Implements fine-grained security controls with policy tiers, allowing for tenant isolation and network segmentation.
- Default Deny Policies: Establishes a “default deny” stance, ensuring only explicitly allowed communications occur.
Example: A financial institution enforces strict tenant isolation and default deny policies to comply with PCI-DSS requirements, securing sensitive customer data.
4. Operational Efficiency
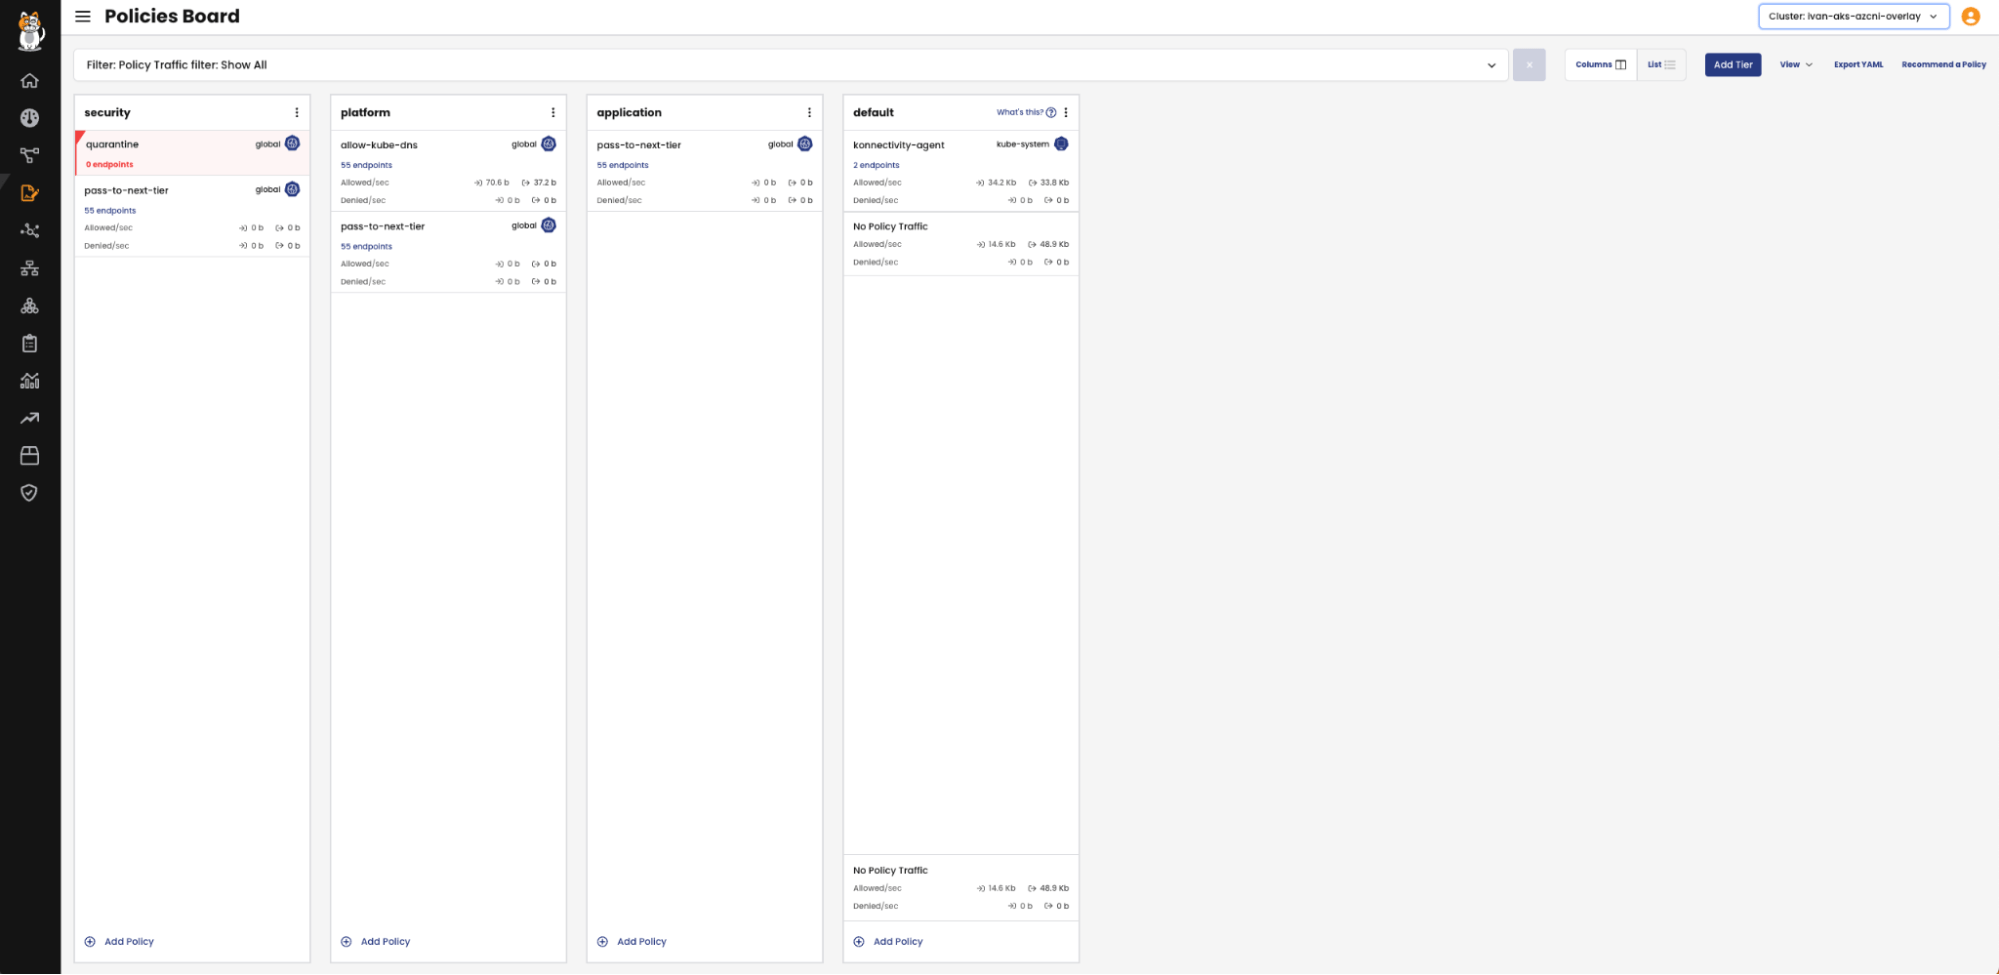
- Policy Tiering: Organizes policies into tiers, enabling different teams to manage their respective policies without conflict.
- GitOps Compatibility: Facilitates policy management through version-controlled repositories, ensuring consistency across deployments.
Outcome
By leveraging Calico’s capabilities, organizations achieve:
- Improved Security: Enhanced visibility and control reduce the attack surface and strengthen defenses.
- Operational Agility: Simplified troubleshooting and efficient policy management accelerate response times and resource allocation.
- Regulatory Compliance: Robust security measures ensure adherence to industry standards and regulations.
- Scalability: Structured policy management and observability support seamless scaling of Kubernetes environments.
Try it yourself with our free, self-paced tutorial, Mastering Kubernetes Networking & Security at Scale.