










Have you ever wondered how to navigate the complexities of managing Kubernetes clusters effectively? Observability is the key, and Elasticsearch plays a pivotal role in storing and analyzing the critical data that keeps your systems running smoothly.
In this blog post, we will delve into the essential aspects of observability within Kubernetes clusters powered by Calico eBPF data plane, highlighting the significance of Elasticsearch in this ecosystem. We’ll explore how Calico leverages Elasticsearch to enhance both observability and security, providing a comprehensive guide to common issues, best practices, and troubleshooting tips. You will understand the value of observability on a Kubernetes cluster and how to keep Elasticsearch healthy by storing and making observability data available. By the end, you’ll be equipped with the knowledge to maintain a robust and efficient Elasticsearch setup, ensuring optimal performance and security for your Kubernetes cluster powered by Calico eBPF data plane.
We will discuss what Elasticsearch is, why it matters, and how Calico Enterprise utilizes it to provide unparalleled observability. Whether you’re dealing with common issues or looking to implement best practices, this guide will serve as your reference guide to maintain a healthy Elasticsearch setup.
The importance of observability in a Kubernetes cluster
Kubernetes clusters are becoming increasingly complex, with more and more applications and services being added to them every day. This growing complexity makes it essential to have robust observability to ensure that your clusters are running smoothly. Observability is not just about monitoring; it’s about gaining a deep understanding of what’s happening within your cluster at any given moment. It allows you to track the flows/traffic of your applications, identify potential breaches, attacks and undesired allows, and take proactive measures to prevent downtime.
Calico Observability enables you to monitor the health of your cluster’s traffic, identify and troubleshoot issues, and ensure that your traffic has been enforced as expected. With the right observability tools, you can get real-time insights into your cluster’s traffic and quickly pinpoint any problems that arise. This means faster resolution times and less downtime, which is crucial for maintaining high availability and user satisfaction.
Calico Enterprise Observability provides a comprehensive solution for observability in Kubernetes clusters. With features such as real-time monitoring, historical data analysis, and anomaly detection, it offers a robust framework for keeping your cluster healthy and efficient. Real-time monitoring allows you to see what’s happening in your cluster right now, while historical data analysis helps you understand trends and patterns over time. Anomaly detection can alert you to unusual behaviors or performance issues, enabling you to take swift action before they become major problems.
Elasticsearch: What it is and why it matters
Elasticsearch is a powerful search and analytics engine designed to handle a wide array of data types, including structured, unstructured, and time-series data. Its robust capabilities make it an invaluable tool for observability in complex environments, particularly when managing Kubernetes clusters. By providing near real-time search and analysis, Elasticsearch enables administrators to gain comprehensive insights into their cluster’s performance and health.
One of the standout features of Elasticsearch is its remarkable scalability. It can be deployed on a single server for smaller setups or across multiple nodes in a cluster to accommodate the growing demands of larger enterprises. This flexibility ensures that organizations can start small and scale up as their data and workload requirements increase. Additionally, Elasticsearch is designed with fault-tolerance in mind, ensuring that it remains operational even if some nodes fail. This reliability is crucial for maintaining the continuous availability of observability data, which is essential for proactive cluster management.
Calico Enterprise observability & Elasticsearch
Calico with Elasticsearch provides powerful search and analytics capabilities making it an ideal choice for handling the vast amounts of data generated by Kubernetes workloads. By using Elasticsearch, Calico ensures that you have a reliable and scalable storage solution for your observability data, which is critical for maintaining the health and performance of your cluster.
By integrating Elasticsearch, Calico ensures that vast amounts of observability data are efficiently stored and readily accessible for analysis. This includes critical data types such as flow logs, DNS queries, and audit records, which are essential for maintaining a comprehensive view of cluster performance and security.
The efficiency of Elasticsearch in handling large volumes of data makes it an ideal choice for observability and security management. Calico’s detailed logging capabilities, powered by Elasticsearch, enable quick and effective troubleshooting. Administrators can easily identify and analyze unwanted traffic patterns, which is crucial for maintaining the integrity of the Kubernetes cluster. This detailed logging also supports the creation of effective network policies, aligning with a strong zero-trust security model.
Moreover, the analytical power of Elasticsearch facilitates deep insights into cluster behavior. By storing and analyzing observability data, administrators can proactively identify potential issues and take preventive measures. This not only enhances the overall performance of the Kubernetes cluster but also ensures that security measures are robust and effective. The integration of Elasticsearch in Calico Enterprise provides a reliable and scalable storage solution, ensuring that all observability data is securely retained and readily available for analysis when needed.
Common issues with Elasticsearch
When leveraging Elasticsearch for observability in complex Kubernetes environments, it’s essential to be aware of common issues that can affect performance and data integrity. One of the primary challenges is performance bottlenecks, which often stem from hardware limitations. Inadequate CPU, memory, or disk resources can significantly hinder the system’s efficiency, leading to slow query responses and reduced overall performance. Ensuring that the underlying hardware meets the demands of Elasticsearch is crucial for maintaining optimal functionality.
Data corruption is another significant concern that can disrupt the reliability of observability data. This issue can arise from various factors, such as disk failures or network-related problems. Disk failures can lead to incomplete writes or data loss, while network issues can cause corruption during data transfer. To safeguard against data loss, implementing the right number of replicas are essential. Regularly monitoring and maintaining the health of your storage infrastructure can help mitigate these risks and ensure the integrity of your observability data.
Lastly, storage space exhaustion is a critical issue that can impact the functionality of Elasticsearch. As observability data grows, it’s crucial to monitor storage usage to prevent the system from running out of space. Exhausted storage can lead to failed writes, data loss, and degraded performance. Regularly reviewing storage usage and planning for future growth will ensure that your Elasticsearch setup remains robust and capable of handling the increasing volume of observability data.
Best practices for Elasticsearch
Maintaining a healthy Elasticsearch setup is crucial for effective observability in Kubernetes clusters. One of the foremost best practices is appropriately sizing your Elasticsearch cluster to handle the expected volume and throughput of observability data. This involves understanding your data ingestion rates and ensuring that your cluster has sufficient resources, such as CPU, memory, and disk space, to manage the data efficiently. Proper sizing not only prevents performance bottlenecks but also ensures that your cluster can scale as your observability needs to grow. In our documentation, we provide some guidelines to size the Elasticsearch.
Another critical aspect is managing data retention policies effectively. Observability data can accumulate rapidly, leading to significant storage requirements. Implementing well-defined retention policies helps balance the need for historical analysis with the practical constraints of storage capacity. This includes setting appropriate retention periods for different types of data and storage sizes as per our documentation below:
Regularly reviewing and adjusting these policies based on your data usage patterns can optimize resource utilization and maintain cluster performance.
Configuring Grafana to effectively monitor your observability data is another essential best practice. Grafana dashboards provide visual insights into the health and performance of your Elasticsearch cluster. By setting up relevant metrics and alerts, you can proactively identify issues such as high memory and CPU usage, Elasticsearch status, and storage utilization, among others. This article provides a Grafana Dashboard which you can use to monitor Elasticsearch.
First, we need to deploy Grafana, and this can be achieved through the knowledge base article “How to add Calico Prometheus metrics to Grafana after Calico Enterprise v3.12”.
Afterward, the Dashboard provided in this article can be imported to Grafana and the explanation for the panels is below:
- Overview row:

This row provides the overview of the cluster with the current Elasticsearch status, CPU and memory utilization and number of Elasticsearch nodes.
- Disk row:
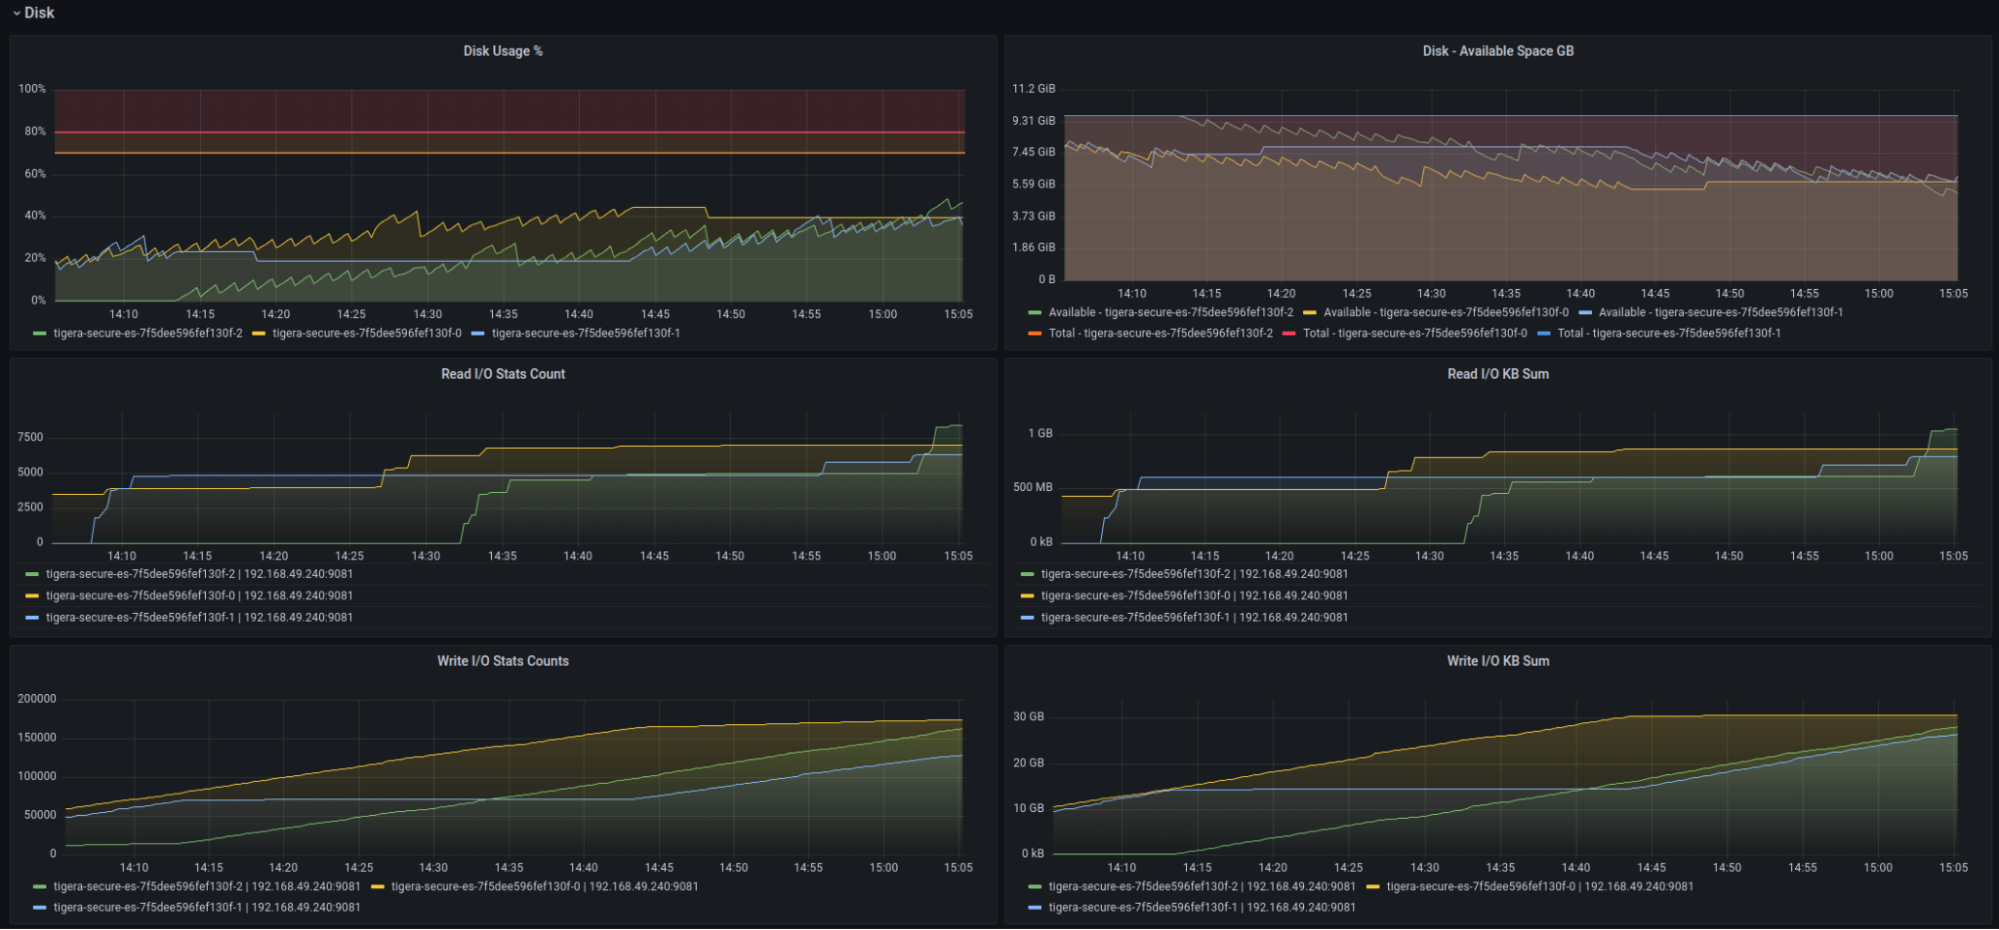
The disk row provides historical data on storage usage and Read/Write I/O operations within the cluster. This enables monitoring of disk space utilization, helping prevent running out of storage. Additionally, it allows tracking trends and spikes in disk I/O activity, which can help identify potential issues or performance bottlenecks.
- CPU and Memory row:
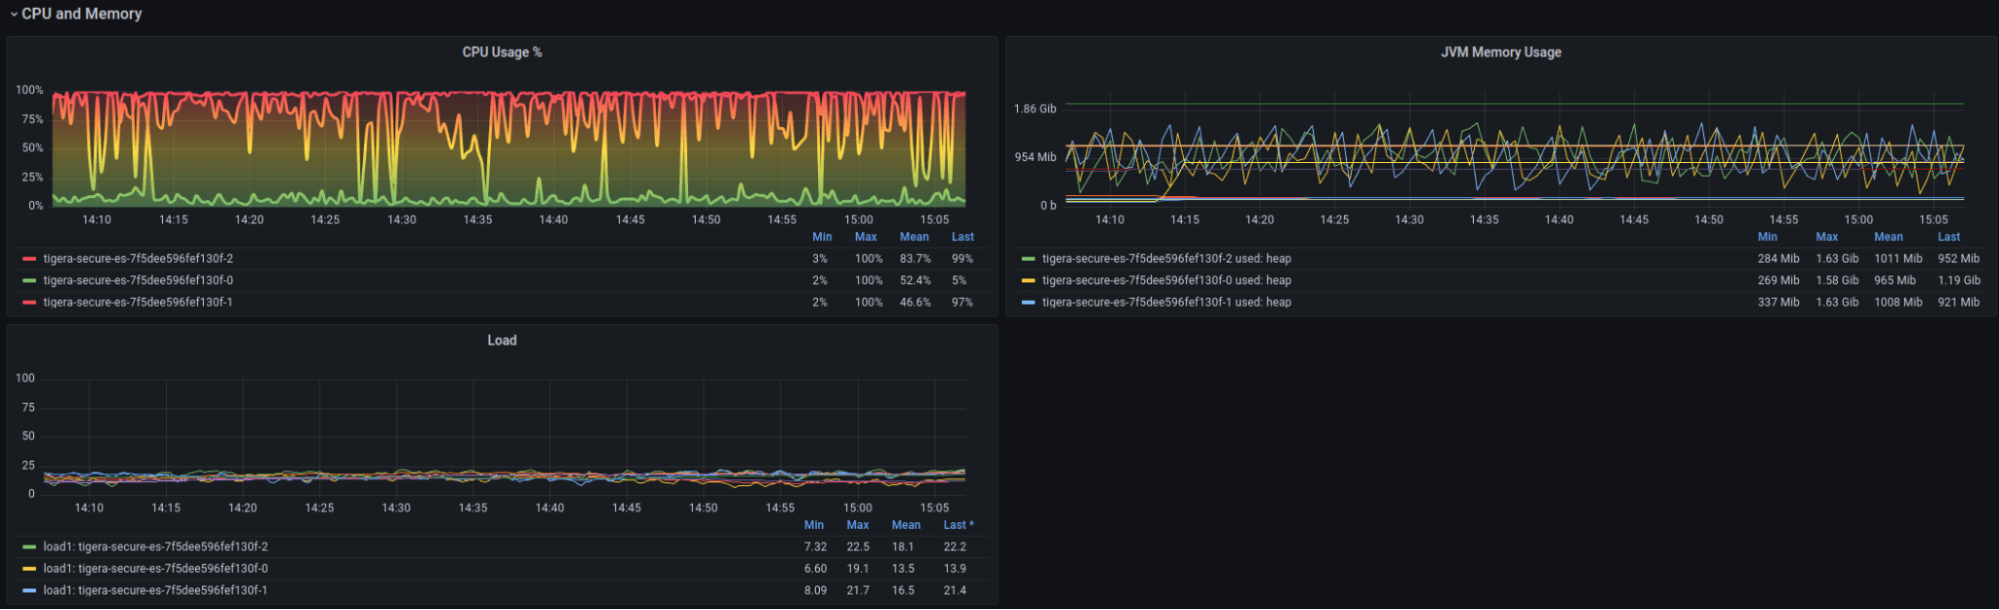
The CPU and Memory panels provide historical CPU, Memory and Load, pointing to any CPU or Memory constraint.
- Indices row:
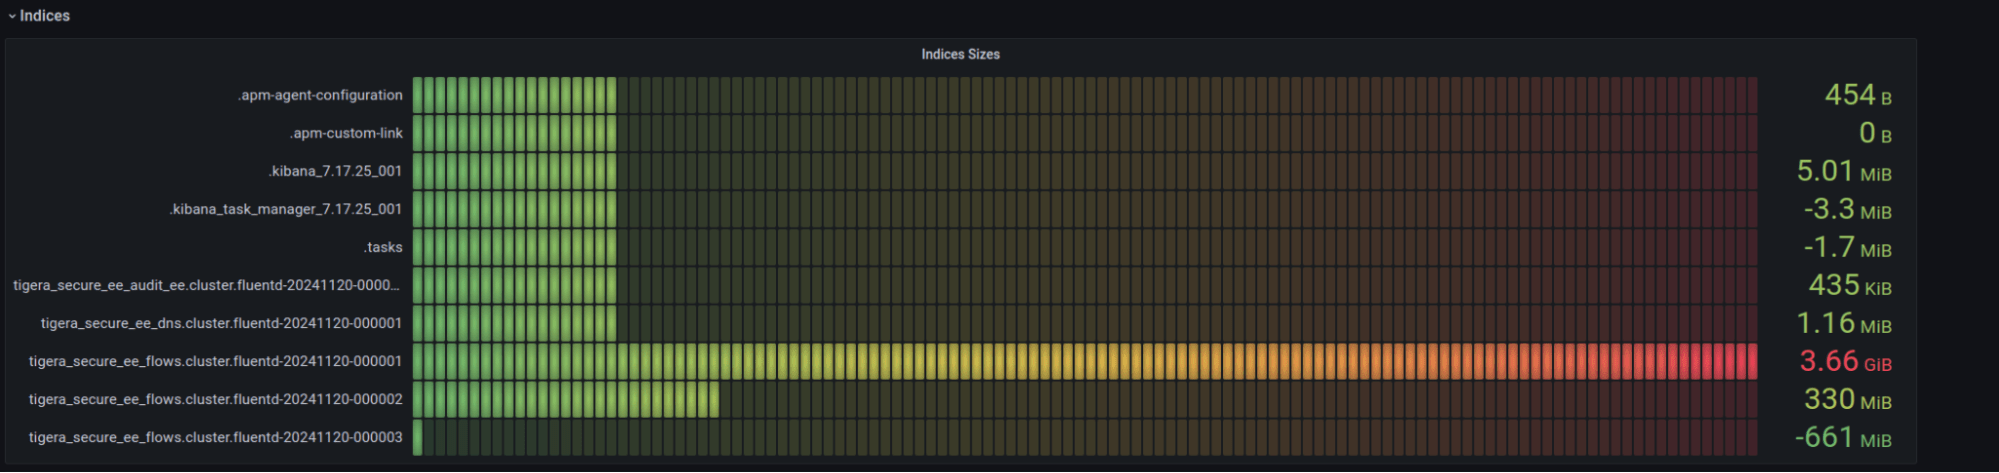
The panel will provide current information about the Indices sizes, hence it helps to identify what indices are bigger and utilize more space. It guides the retention configuration based on the logs/info which requires a longer retention time.
- Shards row:
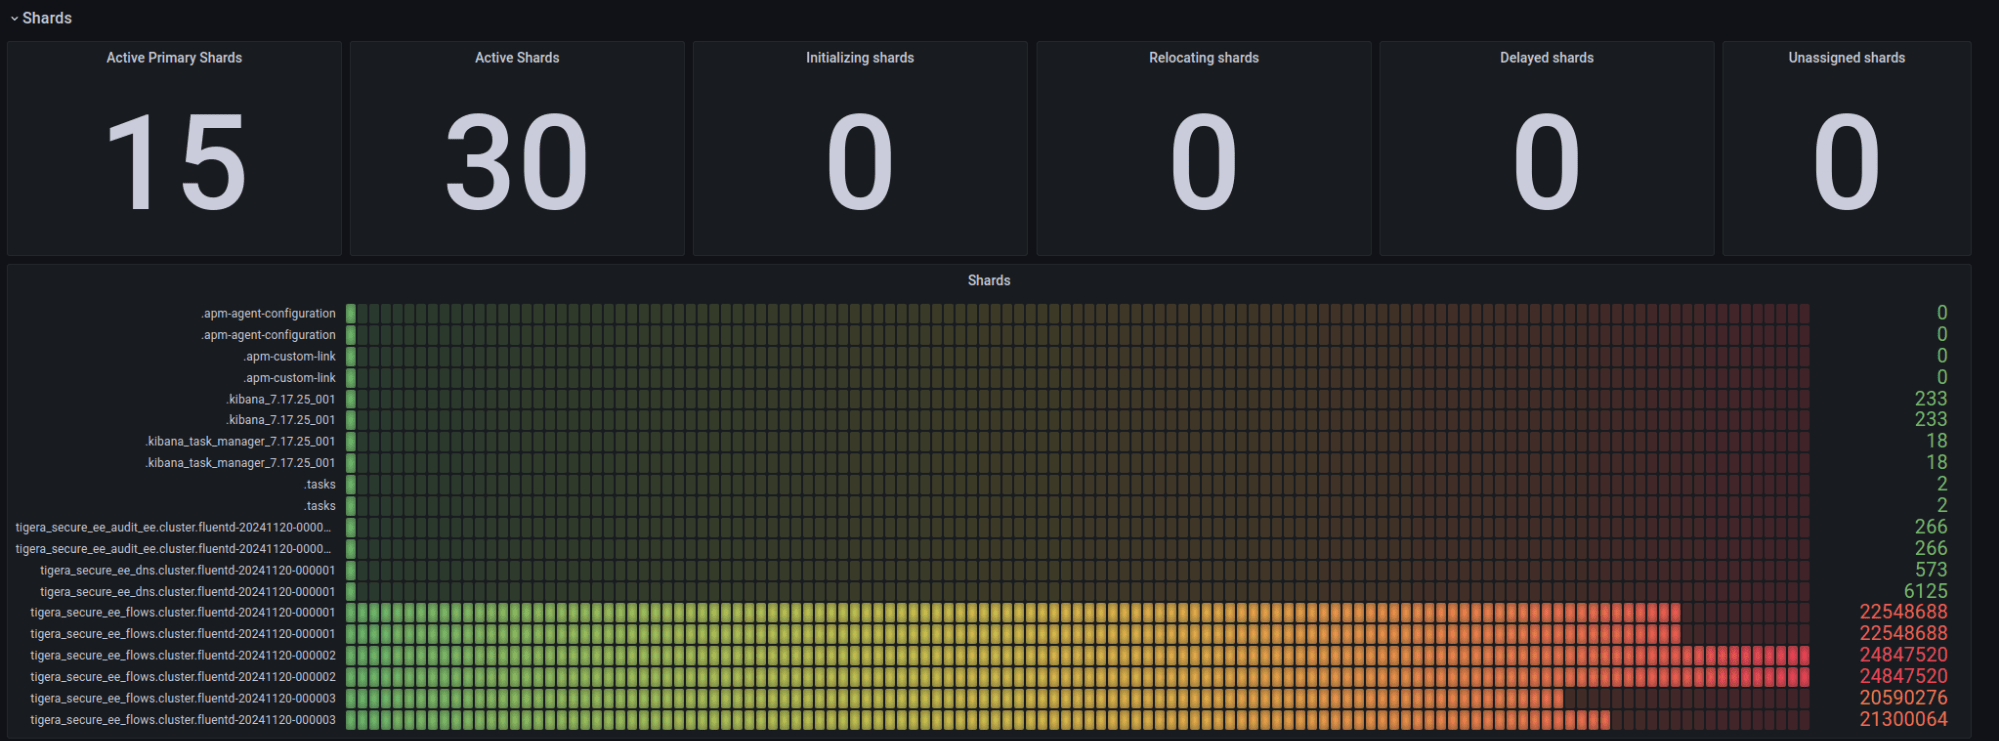
This panel shows the summary of the Shards and their distribution across the indices.
- Active Primary Shards: The count of primary shards that are currently active.
- Active Shards: The total count of active shards (primary + replica). As this example is configured with 1 replica, the “Active Shards” are twice the “Active Primary Shards”.
- Initializing Shards: The count of shards that are in the process of being initialized.
- Relocating Shards: The number of shards being moved from one node to another.
- Delayed Shards: The number of shards that are unassigned but have their allocation deliberately delayed.
- Unassigned Shards: The total count of shards that are currently unassigned.
The Grafana Dashboard provides visibility into Tigera Elasticsearch’s overall status, and alerts can also be configured based on Prometheus metrics, which are not covered in this article.
Troubleshooting Elasticsearch
Tigera offers a collection of knowledge base articles to assist users in diagnosing and resolving Elasticsearch-related issues. These articles, available in the Tigera Help Center, provide detailed insights into common problems, their root causes, and practical troubleshooting techniques.
Additionally, Tigera’s official documentation includes comprehensive steps for troubleshooting Elasticsearch as part of the Calico Enterprise stack. It covers various scenarios, including common problems, checklists, and recreations of Elasticsearch, helping users maintain the health and efficiency of their deployments.
By leveraging these resources, users can address challenges effectively and ensure their Elasticsearch setup operates smoothly.
Grafana Dashboard
{
"__inputs": [
{
"name": "DS_PROMETHEUS",
"label": "Prometheus",
"description": "",
"type": "datasource",
"pluginId": "prometheus",
"pluginName": "Prometheus"
}
],
"__elements": [],
"__requires": [
{
"type": "panel",
"id": "bargauge",
"name": "Bar gauge",
"version": ""
},
{
"type": "panel",
"id": "gauge",
"name": "Gauge",
"version": ""
},
{
"type": "grafana",
"id": "grafana",
"name": "Grafana",
"version": "8.4.4"
},
{
"type": "datasource",
"id": "prometheus",
"name": "Prometheus",
"version": "1.0.0"
},
{
"type": "panel",
"id": "stat",
"name": "Stat",
"version": ""
},
{
"type": "panel",
"id": "timeseries",
"name": "Time series",
"version": ""
}
],
"annotations": {
"list": [
{
"builtIn": 1,
"datasource": "-- Grafana --",
"enable": true,
"hide": true,
"iconColor": "rgba(0, 211, 255, 1)",
"name": "Annotations & Alerts",
"target": {
"limit": 100,
"matchAny": false,
"tags": [],
"type": "dashboard"
},
"type": "dashboard"
}
]
},
"editable": true,
"fiscalYearStartMonth": 0,
"graphTooltip": 0,
"id": null,
"iteration": 1732094636848,
"links": [],
"liveNow": false,
"panels": [
{
"collapsed": false,
"gridPos": {
"h": 1,
"w": 24,
"x": 0,
"y": 0
},
"id": 16,
"panels": [],
"title": "Overview",
"type": "row"
},
{
"fieldConfig": {
"defaults": {
"color": {
"mode": "thresholds"
},
"mappings": [
{
"options": {
"2": {
"color": "dark-yellow",
"index": 0,
"text": "Yellow"
},
"3": {
"color": "dark-red",
"index": 1,
"text": "Red"
},
"4": {
"color": "dark-green",
"index": 2,
"text": "Green"
}
},
"type": "value"
}
],
"thresholds": {
"mode": "absolute",
"steps": [
{
"color": "text",
"value": null
}
]
}
},
"overrides": []
},
"gridPos": {
"h": 6,
"w": 4,
"x": 0,
"y": 1
},
"id": 2,
"options": {
"colorMode": "value",
"graphMode": "none",
"justifyMode": "auto",
"orientation": "auto",
"reduceOptions": {
"calcs": [
"lastNotNull"
],
"fields": "",
"values": false
},
"textMode": "auto"
},
"pluginVersion": "8.4.4",
"targets": [
{
"datasource": {
"type": "prometheus",
"uid": "${DS_PROMETHEUS}"
},
"exemplar": false,
"expr": "(elasticsearch_cluster_health_status{color="yellow"} == 1) + 1",
"format": "time_series",
"instant": true,
"interval": "",
"intervalFactor": 2,
"legendFormat": "",
"refId": "A"
},
{
"datasource": {
"type": "prometheus",
"uid": "${DS_PROMETHEUS}"
},
"exemplar": false,
"expr": "(elasticsearch_cluster_health_status{color="red"} == 1) + 2",
"hide": false,
"instant": true,
"interval": "",
"legendFormat": "",
"refId": "B"
},
{
"datasource": {
"type": "prometheus",
"uid": "${DS_PROMETHEUS}"
},
"exemplar": false,
"expr": "(elasticsearch_cluster_health_status{color="green"} == 1) + 3",
"hide": false,
"instant": true,
"interval": "",
"legendFormat": "",
"refId": "C"
}
],
"title": "Elasticsearch Health Status",
"transformations": [],
"type": "stat"
},
{
"fieldConfig": {
"defaults": {
"mappings": [],
"max": 100,
"min": 0,
"thresholds": {
"mode": "absolute",
"steps": [
{
"color": "green",
"value": null
},
{
"color": "#EAB839",
"value": 70
},
{
"color": "dark-red",
"value": 80
}
]
},
"unit": "percent"
},
"overrides": []
},
"gridPos": {
"h": 6,
"w": 4,
"x": 4,
"y": 1
},
"id": 12,
"options": {
"orientation": "auto",
"reduceOptions": {
"calcs": [
"lastNotNull"
],
"fields": "",
"values": false
},
"showThresholdLabels": false,
"showThresholdMarkers": true
},
"pluginVersion": "8.4.4",
"targets": [
{
"datasource": {
"type": "prometheus",
"uid": "${DS_PROMETHEUS}"
},
"exemplar": false,
"expr": "elasticsearch_process_cpu_percent{}",
"instant": true,
"interval": "",
"legendFormat": "{{name}}",
"refId": "A"
}
],
"title": "CPU Usage %",
"type": "gauge"
},
{
"fieldConfig": {
"defaults": {
"mappings": [],
"max": 100,
"min": 0,
"thresholds": {
"mode": "absolute",
"steps": [
{
"color": "green",
"value": null
},
{
"color": "orange",
"value": 70
},
{
"color": "red",
"value": 80
}
]
},
"unit": "percent"
},
"overrides": []
},
"gridPos": {
"h": 6,
"w": 4,
"x": 8,
"y": 1
},
"id": 14,
"options": {
"orientation": "auto",
"reduceOptions": {
"calcs": [
"lastNotNull"
],
"fields": "",
"values": false
},
"showThresholdLabels": false,
"showThresholdMarkers": true
},
"pluginVersion": "8.4.4",
"targets": [
{
"datasource": {
"type": "prometheus",
"uid": "${DS_PROMETHEUS}"
},
"exemplar": false,
"expr": "(elasticsearch_jvm_memory_used_bytes{} / elasticsearch_jvm_memory_max_bytes{}) * 100",
"instant": true,
"interval": "",
"legendFormat": "{{name}}",
"refId": "A"
}
],
"title": "JVM Memory Usage %",
"type": "gauge"
},
{
"description": "",
"fieldConfig": {
"defaults": {
"color": {
"mode": "thresholds"
},
"mappings": [],
"thresholds": {
"mode": "absolute",
"steps": [
{
"color": "green",
"value": null
},
{
"color": "red",
"value": 80
}
]
}
},
"overrides": []
},
"gridPos": {
"h": 6,
"w": 7,
"x": 12,
"y": 1
},
"id": 10,
"options": {
"colorMode": "none",
"graphMode": "none",
"justifyMode": "auto",
"orientation": "auto",
"reduceOptions": {
"calcs": [
"lastNotNull"
],
"fields": "",
"values": false
},
"textMode": "auto"
},
"pluginVersion": "8.4.4",
"targets": [
{
"datasource": {
"type": "prometheus",
"uid": "${DS_PROMETHEUS}"
},
"exemplar": false,
"expr": "elasticsearch_cluster_health_number_of_nodes{}",
"instant": true,
"interval": "",
"legendFormat": "{{instance}}",
"refId": "A"
}
],
"title": "Number of Nodes",
"transformations": [
{
"id": "reduce",
"options": {
"includeTimeField": false,
"labelsToFields": true,
"mode": "seriesToRows",
"reducers": []
}
}
],
"type": "stat"
},
{
"collapsed": false,
"gridPos": {
"h": 1,
"w": 24,
"x": 0,
"y": 7
},
"id": 20,
"panels": [],
"title": "Disk",
"type": "row"
},
{
"fieldConfig": {
"defaults": {
"color": {
"mode": "palette-classic"
},
"custom": {
"axisLabel": "",
"axisPlacement": "auto",
"barAlignment": 0,
"drawStyle": "line",
"fillOpacity": 10,
"gradientMode": "none",
"hideFrom": {
"legend": false,
"tooltip": false,
"viz": false
},
"lineInterpolation": "linear",
"lineWidth": 1,
"pointSize": 5,
"scaleDistribution": {
"type": "linear"
},
"showPoints": "never",
"spanNulls": true,
"stacking": {
"group": "A",
"mode": "none"
},
"thresholdsStyle": {
"mode": "line+area"
}
},
"mappings": [],
"max": 100,
"min": 0,
"thresholds": {
"mode": "absolute",
"steps": [
{
"color": "transparent",
"value": null
},
{
"color": "orange",
"value": 70
},
{
"color": "red",
"value": 80
}
]
},
"unit": "percent"
},
"overrides": []
},
"gridPos": {
"h": 9,
"w": 12,
"x": 0,
"y": 8
},
"id": 4,
"options": {
"legend": {
"calcs": [],
"displayMode": "list",
"placement": "bottom"
},
"tooltip": {
"mode": "multi",
"sort": "none"
}
},
"pluginVersion": "8.4.4",
"targets": [
{
"datasource": {
"type": "prometheus",
"uid": "${DS_PROMETHEUS}"
},
"exemplar": true,
"expr": "(1 - (elasticsearch_filesystem_data_available_bytes / elasticsearch_filesystem_data_size_bytes)) * 100",
"interval": "",
"legendFormat": "{{name}}",
"refId": "A"
}
],
"title": "Disk Usage %",
"type": "timeseries"
},
{
"fieldConfig": {
"defaults": {
"color": {
"mode": "palette-classic"
},
"custom": {
"axisLabel": "",
"axisPlacement": "auto",
"barAlignment": 0,
"drawStyle": "line",
"fillOpacity": 10,
"gradientMode": "none",
"hideFrom": {
"legend": false,
"tooltip": false,
"viz": false
},
"lineInterpolation": "linear",
"lineWidth": 1,
"pointSize": 5,
"scaleDistribution": {
"type": "linear"
},
"showPoints": "never",
"spanNulls": true,
"stacking": {
"group": "A",
"mode": "none"
},
"thresholdsStyle": {
"mode": "off"
}
},
"mappings": [],
"min": 0,
"thresholds": {
"mode": "absolute",
"steps": [
{
"color": "green",
"value": null
},
{
"color": "red",
"value": 80
}
]
},
"unit": "bytes"
},
"overrides": []
},
"gridPos": {
"h": 9,
"w": 12,
"x": 12,
"y": 8
},
"id": 6,
"options": {
"legend": {
"calcs": [],
"displayMode": "list",
"placement": "bottom"
},
"tooltip": {
"mode": "multi",
"sort": "none"
}
},
"pluginVersion": "8.4.4",
"targets": [
{
"datasource": {
"type": "prometheus",
"uid": "${DS_PROMETHEUS}"
},
"exemplar": true,
"expr": "elasticsearch_filesystem_data_available_bytes{}",
"interval": "",
"legendFormat": "Available - {{name}}",
"refId": "A"
},
{
"datasource": {
"type": "prometheus",
"uid": "${DS_PROMETHEUS}"
},
"exemplar": true,
"expr": "elasticsearch_filesystem_data_size_bytes{}",
"hide": false,
"interval": "",
"legendFormat": "Total - {{name}}",
"refId": "B"
}
],
"title": "Disk - Available Space GB",
"type": "timeseries"
},
{
"fieldConfig": {
"defaults": {
"color": {
"mode": "palette-classic"
},
"custom": {
"axisLabel": "",
"axisPlacement": "auto",
"barAlignment": 0,
"drawStyle": "line",
"fillOpacity": 19,
"gradientMode": "opacity",
"hideFrom": {
"legend": false,
"tooltip": false,
"viz": false
},
"lineInterpolation": "linear",
"lineWidth": 1,
"pointSize": 5,
"scaleDistribution": {
"type": "linear"
},
"showPoints": "auto",
"spanNulls": false,
"stacking": {
"group": "A",
"mode": "none"
},
"thresholdsStyle": {
"mode": "off"
}
},
"mappings": [],
"thresholds": {
"mode": "absolute",
"steps": [
{
"color": "green",
"value": null
},
{
"color": "red",
"value": 80
}
]
}
},
"overrides": []
},
"gridPos": {
"h": 8,
"w": 12,
"x": 0,
"y": 17
},
"id": 48,
"options": {
"legend": {
"calcs": [],
"displayMode": "table",
"placement": "bottom"
},
"tooltip": {
"mode": "single",
"sort": "none"
}
},
"targets": [
{
"datasource": {
"type": "prometheus",
"uid": "${DS_PROMETHEUS}"
},
"exemplar": true,
"expr": "elasticsearch_filesystem_io_stats_device_read_operations_count{}",
"interval": "",
"legendFormat": "{{name}} | {{instance}}",
"refId": "A"
}
],
"title": "Read I/O Stats Count",
"type": "timeseries"
},
{
"fieldConfig": {
"defaults": {
"color": {
"mode": "palette-classic"
},
"custom": {
"axisLabel": "",
"axisPlacement": "auto",
"barAlignment": 0,
"drawStyle": "line",
"fillOpacity": 23,
"gradientMode": "opacity",
"hideFrom": {
"legend": false,
"tooltip": false,
"viz": false
},
"lineInterpolation": "linear",
"lineWidth": 1,
"pointSize": 5,
"scaleDistribution": {
"type": "linear"
},
"showPoints": "auto",
"spanNulls": false,
"stacking": {
"group": "A",
"mode": "none"
},
"thresholdsStyle": {
"mode": "off"
}
},
"mappings": [],
"thresholds": {
"mode": "absolute",
"steps": [
{
"color": "green",
"value": null
},
{
"color": "red",
"value": 80
}
]
},
"unit": "deckbytes"
},
"overrides": []
},
"gridPos": {
"h": 8,
"w": 12,
"x": 12,
"y": 17
},
"id": 50,
"options": {
"legend": {
"calcs": [],
"displayMode": "table",
"placement": "bottom"
},
"tooltip": {
"mode": "single",
"sort": "none"
}
},
"targets": [
{
"datasource": {
"type": "prometheus",
"uid": "${DS_PROMETHEUS}"
},
"exemplar": true,
"expr": "elasticsearch_filesystem_io_stats_device_read_size_kilobytes_sum{}",
"interval": "",
"legendFormat": "{{name}} | {{instance}}",
"refId": "A"
}
],
"title": "Read I/O KB Sum",
"type": "timeseries"
},
{
"fieldConfig": {
"defaults": {
"color": {
"mode": "palette-classic"
},
"custom": {
"axisLabel": "",
"axisPlacement": "auto",
"barAlignment": 0,
"drawStyle": "line",
"fillOpacity": 22,
"gradientMode": "opacity",
"hideFrom": {
"legend": false,
"tooltip": false,
"viz": false
},
"lineInterpolation": "linear",
"lineWidth": 1,
"pointSize": 5,
"scaleDistribution": {
"type": "linear"
},
"showPoints": "auto",
"spanNulls": false,
"stacking": {
"group": "A",
"mode": "none"
},
"thresholdsStyle": {
"mode": "off"
}
},
"mappings": [],
"thresholds": {
"mode": "absolute",
"steps": [
{
"color": "green",
"value": null
},
{
"color": "red",
"value": 80
}
]
}
},
"overrides": []
},
"gridPos": {
"h": 8,
"w": 12,
"x": 0,
"y": 25
},
"id": 52,
"options": {
"legend": {
"calcs": [],
"displayMode": "list",
"placement": "bottom"
},
"tooltip": {
"mode": "single",
"sort": "none"
}
},
"targets": [
{
"datasource": {
"type": "prometheus",
"uid": "${DS_PROMETHEUS}"
},
"exemplar": true,
"expr": "elasticsearch_filesystem_io_stats_device_write_operations_count{}",
"interval": "",
"legendFormat": "{{name}} | {{instance}}",
"refId": "A"
}
],
"title": "Write I/O Stats Counts",
"type": "timeseries"
},
{
"fieldConfig": {
"defaults": {
"color": {
"mode": "palette-classic"
},
"custom": {
"axisLabel": "",
"axisPlacement": "auto",
"barAlignment": 0,
"drawStyle": "line",
"fillOpacity": 22,
"gradientMode": "opacity",
"hideFrom": {
"legend": false,
"tooltip": false,
"viz": false
},
"lineInterpolation": "linear",
"lineWidth": 1,
"pointSize": 5,
"scaleDistribution": {
"type": "linear"
},
"showPoints": "auto",
"spanNulls": false,
"stacking": {
"group": "A",
"mode": "none"
},
"thresholdsStyle": {
"mode": "off"
}
},
"mappings": [],
"thresholds": {
"mode": "absolute",
"steps": [
{
"color": "green",
"value": null
},
{
"color": "red",
"value": 80
}
]
},
"unit": "deckbytes"
},
"overrides": []
},
"gridPos": {
"h": 8,
"w": 12,
"x": 12,
"y": 25
},
"id": 54,
"options": {
"legend": {
"calcs": [],
"displayMode": "list",
"placement": "bottom"
},
"tooltip": {
"mode": "single",
"sort": "none"
}
},
"targets": [
{
"datasource": {
"type": "prometheus",
"uid": "${DS_PROMETHEUS}"
},
"exemplar": true,
"expr": "elasticsearch_filesystem_io_stats_device_write_size_kilobytes_sum{}",
"interval": "",
"legendFormat": "{{name}} | {{instance}}",
"refId": "A"
}
],
"title": "Write I/O KB Sum",
"type": "timeseries"
},
{
"collapsed": false,
"gridPos": {
"h": 1,
"w": 24,
"x": 0,
"y": 33
},
"id": 18,
"panels": [],
"title": "CPU and Memory",
"type": "row"
},
{
"fieldConfig": {
"defaults": {
"color": {
"mode": "continuous-GrYlRd"
},
"custom": {
"axisLabel": "",
"axisPlacement": "auto",
"barAlignment": 0,
"drawStyle": "line",
"fillOpacity": 20,
"gradientMode": "scheme",
"hideFrom": {
"legend": false,
"tooltip": false,
"viz": false
},
"lineInterpolation": "smooth",
"lineWidth": 3,
"pointSize": 5,
"scaleDistribution": {
"type": "linear"
},
"showPoints": "auto",
"spanNulls": false,
"stacking": {
"group": "A",
"mode": "none"
},
"thresholdsStyle": {
"mode": "off"
}
},
"mappings": [],
"max": 100,
"min": 0,
"thresholds": {
"mode": "absolute",
"steps": [
{
"color": "green",
"value": null
},
{
"color": "#EAB839",
"value": 70
},
{
"color": "red",
"value": 80
}
]
},
"unit": "percent"
},
"overrides": []
},
"gridPos": {
"h": 8,
"w": 12,
"x": 0,
"y": 34
},
"id": 22,
"options": {
"legend": {
"calcs": [
"min",
"max",
"mean",
"last"
],
"displayMode": "table",
"placement": "bottom"
},
"tooltip": {
"mode": "single",
"sort": "none"
}
},
"targets": [
{
"datasource": {
"type": "prometheus",
"uid": "${DS_PROMETHEUS}"
},
"exemplar": true,
"expr": "elasticsearch_process_cpu_percent{}",
"interval": "",
"legendFormat": "{{name}}",
"refId": "A"
}
],
"title": "CPU Usage %",
"type": "timeseries"
},
{
"fieldConfig": {
"defaults": {
"color": {
"mode": "palette-classic"
},
"custom": {
"axisLabel": "",
"axisPlacement": "auto",
"barAlignment": 0,
"drawStyle": "line",
"fillOpacity": 0,
"gradientMode": "none",
"hideFrom": {
"legend": false,
"tooltip": false,
"viz": false
},
"lineInterpolation": "linear",
"lineWidth": 1,
"pointSize": 5,
"scaleDistribution": {
"type": "linear"
},
"showPoints": "auto",
"spanNulls": false,
"stacking": {
"group": "A",
"mode": "none"
},
"thresholdsStyle": {
"mode": "off"
}
},
"mappings": [],
"thresholds": {
"mode": "absolute",
"steps": [
{
"color": "green",
"value": null
},
{
"color": "red",
"value": 80
}
]
},
"unit": "bits"
},
"overrides": []
},
"gridPos": {
"h": 8,
"w": 12,
"x": 12,
"y": 34
},
"id": 24,
"options": {
"legend": {
"calcs": [
"min",
"max",
"mean",
"last"
],
"displayMode": "table",
"placement": "bottom"
},
"tooltip": {
"mode": "single",
"sort": "none"
}
},
"targets": [
{
"datasource": {
"type": "prometheus",
"uid": "${DS_PROMETHEUS}"
},
"exemplar": true,
"expr": "elasticsearch_jvm_memory_used_bytes{}",
"interval": "",
"intervalFactor": 2,
"legendFormat": "{{name}} used: {{area}}",
"refId": "A"
},
{
"datasource": {
"type": "prometheus",
"uid": "${DS_PROMETHEUS}"
},
"exemplar": true,
"expr": "elasticsearch_jvm_memory_max_bytes{}",
"hide": false,
"interval": "",
"intervalFactor": 2,
"legendFormat": "{{name}} max: {{area}}",
"refId": "B"
},
{
"datasource": {
"type": "prometheus",
"uid": "${DS_PROMETHEUS}"
},
"exemplar": true,
"expr": "elasticsearch_jvm_memory_pool_peak_used_bytes{}",
"hide": false,
"interval": "",
"intervalFactor": 2,
"legendFormat": "{{name}} peak used pool: {{pool}}",
"refId": "C"
}
],
"title": "JVM Memory Usage",
"type": "timeseries"
},
{
"fieldConfig": {
"defaults": {
"color": {
"mode": "palette-classic"
},
"custom": {
"axisLabel": "",
"axisPlacement": "auto",
"barAlignment": 0,
"drawStyle": "line",
"fillOpacity": 0,
"gradientMode": "none",
"hideFrom": {
"legend": false,
"tooltip": false,
"viz": false
},
"lineInterpolation": "linear",
"lineWidth": 1,
"pointSize": 5,
"scaleDistribution": {
"type": "linear"
},
"showPoints": "auto",
"spanNulls": false,
"stacking": {
"group": "A",
"mode": "none"
},
"thresholdsStyle": {
"mode": "off"
}
},
"mappings": [],
"max": 100,
"min": 0,
"thresholds": {
"mode": "absolute",
"steps": [
{
"color": "green",
"value": null
},
{
"color": "red",
"value": 80
}
]
},
"unit": "none"
},
"overrides": []
},
"gridPos": {
"h": 8,
"w": 12,
"x": 0,
"y": 42
},
"id": 26,
"options": {
"legend": {
"calcs": [
"min",
"max",
"mean",
"lastNotNull"
],
"displayMode": "table",
"placement": "bottom"
},
"tooltip": {
"mode": "single",
"sort": "none"
}
},
"targets": [
{
"datasource": {
"type": "prometheus",
"uid": "${DS_PROMETHEUS}"
},
"exemplar": true,
"expr": "elasticsearch_os_load1{}",
"interval": "",
"legendFormat": "load1: {{name}}",
"refId": "A"
},
{
"datasource": {
"type": "prometheus",
"uid": "${DS_PROMETHEUS}"
},
"exemplar": true,
"expr": "elasticsearch_os_load5{}",
"hide": false,
"interval": "",
"legendFormat": "load5: {{name}}",
"refId": "B"
},
{
"datasource": {
"type": "prometheus",
"uid": "${DS_PROMETHEUS}"
},
"exemplar": true,
"expr": "elasticsearch_os_load15{}",
"hide": false,
"interval": "",
"legendFormat": "load15: {{name}}",
"refId": "C"
}
],
"title": "Load",
"type": "timeseries"
},
{
"collapsed": false,
"gridPos": {
"h": 1,
"w": 24,
"x": 0,
"y": 50
},
"id": 30,
"panels": [],
"title": "Indices",
"type": "row"
},
{
"fieldConfig": {
"defaults": {
"color": {
"mode": "continuous-GrYlRd"
},
"mappings": [],
"thresholds": {
"mode": "absolute",
"steps": [
{
"color": "green",
"value": null
},
{
"color": "red",
"value": 80
}
]
},
"unit": "bytes"
},
"overrides": []
},
"gridPos": {
"h": 12,
"w": 23,
"x": 0,
"y": 51
},
"id": 46,
"options": {
"displayMode": "lcd",
"orientation": "horizontal",
"reduceOptions": {
"calcs": [
"lastNotNull"
],
"fields": "",
"values": false
},
"showUnfilled": true
},
"pluginVersion": "8.4.4",
"targets": [
{
"datasource": {
"type": "prometheus",
"uid": "${DS_PROMETHEUS}"
},
"exemplar": false,
"expr": "elasticsearch_indices_store_size_bytes_total{}",
"format": "heatmap",
"instant": true,
"interval": "",
"legendFormat": "{{index}}",
"refId": "A"
}
],
"title": "Indices Sizes",
"type": "bargauge"
},
{
"collapsed": false,
"gridPos": {
"h": 1,
"w": 24,
"x": 0,
"y": 63
},
"id": 28,
"panels": [],
"title": "Shards",
"type": "row"
},
{
"fieldConfig": {
"defaults": {
"color": {
"mode": "thresholds"
},
"mappings": [],
"thresholds": {
"mode": "absolute",
"steps": [
{
"color": "green",
"value": null
},
{
"color": "red",
"value": 80
}
]
}
},
"overrides": []
},
"gridPos": {
"h": 6,
"w": 4,
"x": 0,
"y": 64
},
"id": 32,
"options": {
"colorMode": "none",
"graphMode": "none",
"justifyMode": "auto",
"orientation": "auto",
"reduceOptions": {
"calcs": [
"lastNotNull"
],
"fields": "",
"values": false
},
"textMode": "auto"
},
"pluginVersion": "8.4.4",
"targets": [
{
"datasource": {
"type": "prometheus",
"uid": "${DS_PROMETHEUS}"
},
"exemplar": false,
"expr": "elasticsearch_cluster_health_active_primary_shards{}",
"instant": true,
"interval": "",
"legendFormat": "",
"refId": "A"
}
],
"title": "Active Primary Shards",
"type": "stat"
},
{
"fieldConfig": {
"defaults": {
"mappings": [],
"thresholds": {
"mode": "absolute",
"steps": [
{
"color": "green",
"value": null
},
{
"color": "red",
"value": 80
}
]
},
"unit": "short"
},
"overrides": []
},
"gridPos": {
"h": 6,
"w": 4,
"x": 4,
"y": 64
},
"id": 34,
"options": {
"colorMode": "none",
"graphMode": "none",
"justifyMode": "auto",
"orientation": "auto",
"reduceOptions": {
"calcs": [
"lastNotNull"
],
"fields": "",
"values": false
},
"textMode": "auto"
},
"pluginVersion": "8.4.4",
"targets": [
{
"datasource": {
"type": "prometheus",
"uid": "${DS_PROMETHEUS}"
},
"exemplar": false,
"expr": "elasticsearch_cluster_health_active_shards{}",
"instant": true,
"interval": "",
"legendFormat": "",
"refId": "A"
}
],
"title": "Active Shards",
"type": "stat"
},
{
"fieldConfig": {
"defaults": {
"mappings": [],
"thresholds": {
"mode": "absolute",
"steps": [
{
"color": "green",
"value": null
},
{
"color": "red",
"value": 80
}
]
},
"unit": "short"
},
"overrides": []
},
"gridPos": {
"h": 6,
"w": 4,
"x": 8,
"y": 64
},
"id": 36,
"options": {
"colorMode": "none",
"graphMode": "none",
"justifyMode": "auto",
"orientation": "auto",
"reduceOptions": {
"calcs": [
"lastNotNull"
],
"fields": "",
"values": false
},
"textMode": "auto"
},
"pluginVersion": "8.4.4",
"targets": [
{
"datasource": {
"type": "prometheus",
"uid": "${DS_PROMETHEUS}"
},
"exemplar": false,
"expr": "elasticsearch_cluster_health_initializing_shards{}",
"instant": true,
"interval": "",
"legendFormat": "",
"refId": "A"
}
],
"title": "Initializing shards",
"type": "stat"
},
{
"fieldConfig": {
"defaults": {
"mappings": [],
"thresholds": {
"mode": "absolute",
"steps": [
{
"color": "green",
"value": null
},
{
"color": "red",
"value": 80
}
]
},
"unit": "short"
},
"overrides": []
},
"gridPos": {
"h": 6,
"w": 4,
"x": 12,
"y": 64
},
"id": 38,
"options": {
"colorMode": "none",
"graphMode": "none",
"justifyMode": "auto",
"orientation": "auto",
"reduceOptions": {
"calcs": [
"lastNotNull"
],
"fields": "",
"values": false
},
"textMode": "auto"
},
"pluginVersion": "8.4.4",
"targets": [
{
"datasource": {
"type": "prometheus",
"uid": "${DS_PROMETHEUS}"
},
"exemplar": false,
"expr": "elasticsearch_cluster_health_relocating_shards{}",
"instant": true,
"interval": "",
"legendFormat": "",
"refId": "A"
}
],
"title": "Relocating shards",
"type": "stat"
},
{
"fieldConfig": {
"defaults": {
"mappings": [],
"thresholds": {
"mode": "absolute",
"steps": [
{
"color": "green",
"value": null
},
{
"color": "red",
"value": 80
}
]
},
"unit": "short"
},
"overrides": []
},
"gridPos": {
"h": 6,
"w": 4,
"x": 16,
"y": 64
},
"id": 40,
"options": {
"colorMode": "none",
"graphMode": "none",
"justifyMode": "auto",
"orientation": "auto",
"reduceOptions": {
"calcs": [
"lastNotNull"
],
"fields": "",
"values": false
},
"textMode": "auto"
},
"pluginVersion": "8.4.4",
"targets": [
{
"datasource": {
"type": "prometheus",
"uid": "${DS_PROMETHEUS}"
},
"exemplar": false,
"expr": "elasticsearch_cluster_health_delayed_unassigned_shards{} ",
"instant": true,
"interval": "",
"legendFormat": "",
"refId": "A"
}
],
"title": "Delayed shards",
"type": "stat"
},
{
"fieldConfig": {
"defaults": {
"mappings": [],
"thresholds": {
"mode": "absolute",
"steps": [
{
"color": "green",
"value": null
},
{
"color": "red",
"value": 80
}
]
},
"unit": "short"
},
"overrides": []
},
"gridPos": {
"h": 6,
"w": 3,
"x": 20,
"y": 64
},
"id": 42,
"options": {
"colorMode": "none",
"graphMode": "none",
"justifyMode": "auto",
"orientation": "auto",
"reduceOptions": {
"calcs": [
"lastNotNull"
],
"fields": "",
"values": false
},
"textMode": "auto"
},
"pluginVersion": "8.4.4",
"targets": [
{
"datasource": {
"type": "prometheus",
"uid": "${DS_PROMETHEUS}"
},
"exemplar": false,
"expr": "elasticsearch_cluster_health_unassigned_shards{} ",
"instant": true,
"interval": "",
"legendFormat": "",
"refId": "A"
}
],
"title": "Unassigned shards",
"type": "stat"
},
{
"fieldConfig": {
"defaults": {
"color": {
"mode": "continuous-GrYlRd"
},
"mappings": [],
"thresholds": {
"mode": "absolute",
"steps": [
{
"color": "green",
"value": null
},
{
"color": "red",
"value": 80
}
]
}
},
"overrides": []
},
"gridPos": {
"h": 13,
"w": 23,
"x": 0,
"y": 70
},
"id": 44,
"options": {
"displayMode": "lcd",
"orientation": "horizontal",
"reduceOptions": {
"calcs": [
"lastNotNull"
],
"fields": "",
"values": false
},
"showUnfilled": true
},
"pluginVersion": "8.4.4",
"targets": [
{
"datasource": {
"type": "prometheus",
"uid": "${DS_PROMETHEUS}"
},
"exemplar": false,
"expr": "elasticsearch_indices_shards_docs{}",
"instant": true,
"interval": "",
"legendFormat": "{{index}} {{shards}}",
"refId": "A"
}
],
"title": "Shards",
"type": "bargauge"
}
],
"refresh": false,
"schemaVersion": 35,
"style": "dark",
"tags": [],
"templating": {
"list": [
{
"current": {
"selected": false,
"text": "Prometheus",
"value": "Prometheus"
},
"hide": 0,
"includeAll": false,
"multi": false,
"name": "datasource",
"options": [],
"query": "prometheus",
"queryValue": "",
"refresh": 1,
"regex": "",
"skipUrlSync": false,
"type": "datasource"
},
{
"current": {},
"datasource": {
"type": "prometheus",
"uid": "${DS_PROMETHEUS}"
},
"definition": "label_values(elasticsearch_cluster_health_status, job)",
"hide": 0,
"includeAll": false,
"multi": false,
"name": "job",
"options": [],
"query": {
"query": "label_values(elasticsearch_cluster_health_status, job)",
"refId": "StandardVariableQuery"
},
"refresh": 1,
"regex": "",
"skipUrlSync": false,
"sort": 0,
"type": "query"
},
{
"current": {},
"datasource": {
"type": "prometheus",
"uid": "${DS_PROMETHEUS}"
},
"definition": "label_values(elasticsearch_indices_docs{job="$job"},cluster)",
"hide": 0,
"includeAll": false,
"multi": false,
"name": "cluster",
"options": [],
"query": {
"query": "label_values(elasticsearch_indices_docs{job="$job"},cluster)",
"refId": "StandardVariableQuery"
},
"refresh": 1,
"regex": "",
"skipUrlSync": false,
"sort": 1,
"type": "query"
},
{
"current": {},
"datasource": {
"type": "prometheus",
"uid": "${DS_PROMETHEUS}"
},
"definition": "label_values(elasticsearch_indices_docs{job="$job", cluster="$cluster", name!=""},name)",
"hide": 0,
"includeAll": true,
"multi": true,
"name": "name",
"options": [],
"query": {
"query": "label_values(elasticsearch_indices_docs{job="$job", cluster="$cluster", name!=""},name)",
"refId": "StandardVariableQuery"
},
"refresh": 1,
"regex": "",
"skipUrlSync": false,
"sort": 1,
"type": "query"
},
{
"current": {},
"datasource": {
"type": "prometheus",
"uid": "${DS_PROMETHEUS}"
},
"definition": "label_values(elasticsearch_indices_docs{job="$job", cluster="$cluster", name!=""},instance)",
"hide": 0,
"includeAll": false,
"multi": false,
"name": "instance",
"options": [],
"query": {
"query": "label_values(elasticsearch_indices_docs{job="$job", cluster="$cluster", name!=""},instance)",
"refId": "StandardVariableQuery"
},
"refresh": 1,
"regex": "",
"skipUrlSync": false,
"sort": 1,
"type": "query"
}
]
},
"time": {
"from": "now-15m",
"to": "now"
},
"timepicker": {},
"timezone": "",
"title": "Tigera Elasticsearch",
"uid": "P1udt3ZNz",
"version": 1,
"weekStart": ""Want to learn more about Calico observability and see it in action? Schedule a demo.