









For DevOps and platform teams working with containers and Kubernetes, reducing downtime and improving security posture is crucial. A clear understanding of network topology, service interactions, and workload dependencies is required in cloud-native applications. This is essential for securing and optimizing the Kubernetes deployment and minimizing response time in the event of failure.
Network observability can highlight gaps in network policies for applications that require network policy controls to reduce the risk of attack from unsecured egress access or lateral movement of threats within the Kubernetes cluster. However, visualizing workload communication, service dependencies, and active and inactive network security policies presents significant challenges due to the distributed and dynamic nature of Kubernetes workloads.
Why is network observability difficult with Kubernetes workloads?
Kubernetes scales up and scales out pods and creates and destroys services depending on real-time business requirements, resulting in dynamic network connections for each workload instance. Network access policies defined for each workload further impact these connections.
In such a scenario, capturing an accurate and up-to-date representation of network traffic, service dependencies, and network policies is difficult. The default Kubernetes implementation provides limited network traffic visibility and policy information, making it challenging for teams to troubleshoot connectivity issues, improve security, and demonstrate compliance.
Limitations of general-purpose observability tools
DevOps and platform teams often rely on general-purpose observability tools to gain visibility into workload communication and network policies.
Network observability for secure communication
In terms of security, a common difficulty reported by DevOps and platform teams is the inability of general-purpose observability solutions to effectively monitor communications between workloads and into or out of the cluster. Kubernetes network and security policies determine access in the cluster. Real-time mapping of these policies to traffic flow in the Kubernetes cluster is critical to understanding a deployment’s behavior.
Due to the dynamic and ephemeral nature of Kubernetes, traditional monitoring tools are unable to map policies and flows that can scale with the application. This leads to challenges in developing, implementing, and validating effective network policies during runtime.
Data aggregation and correlation
Kubernetes creates a large number of ephemeral objects that generate data across a distributed environment. This data needs to be aggregated and correlated to visualize the interactions and activities in the environment. Furthermore, Kubernetes context such as pods, services, and namespaces has to be added to the data, which requires time and resources such as extra compute, memory, and storage.
Kubernetes context
Kubernetes adds a layer of abstraction on top of hosts and VMs. While collecting and aggregating data from individual containers and hosts is important, the data needs to be correlated and aggregated at different levels of Kubernetes abstractions.
 Most general-purpose observability tools export data from Kubernetes clusters and use extensive computing resources to aggregate and correlate this data. This is costly and limited in functionality. For Kubernetes network observability, it is critical that the observability tooling is Kubernetes native and operates inside the cluster.
Kubernetes-native network observability
The default setup of Kubernetes provides restricted insights into visibility and policy information, often requiring users to compile data from multiple sources to obtain a comprehensive view.
Commonly, one would execute various kubectl commands to gather siloed information across the Kubernetes stack. For instance, running kubectl get pods helps retrieve a list of all running pods within a cluster, whereas kubectl get networkpolicies displays all the NetworkPolicy resources defined. Gaining visibility into traffic and policies using kubectl commands is notably cumbersome and inefficient for a distributed Kubernetes environment.
Additionally, visibility into infrastructure metrics like network flows and DNS logs can be achieved through open-source monitoring tools such as Prometheus and Grafana, which help track both encrypted and non-encrypted data. General-purpose monitoring solutions typically gather metrics at the node, container, or pod levels, which leads to isolated data silos. These silos then require complex aggregation and correlation at the application and microservices levels to effectively monitor and troubleshoot issues like application behavior, performance bottlenecks, and communication problems.
This method struggles with scalability due to the vast amount of granular data generated and the transient nature of interactions within the dynamic infrastructure of Kubernetes. For more detailed analysis, third-party monitoring tools like Datadog, Dynatrace, and Splunk are often leveraged to collect logs, metrics, and to build comprehensive dashboards. Moreover, using pre-built dashboards provided by managed service providers can offer a streamlined way to track and analyze statistical data, facilitating better operational oversight and strategic planning within the Kubernetes environment.
Kubernetes Network observability with Calico
Calico Cloud provides Kubernetes-native, purpose-built observability and troubleshooting for Kubernetes environments, enhancing the ability to quickly resolve connectivity issues, strengthen security postures, and understand network topologies in real time.
Network metrics
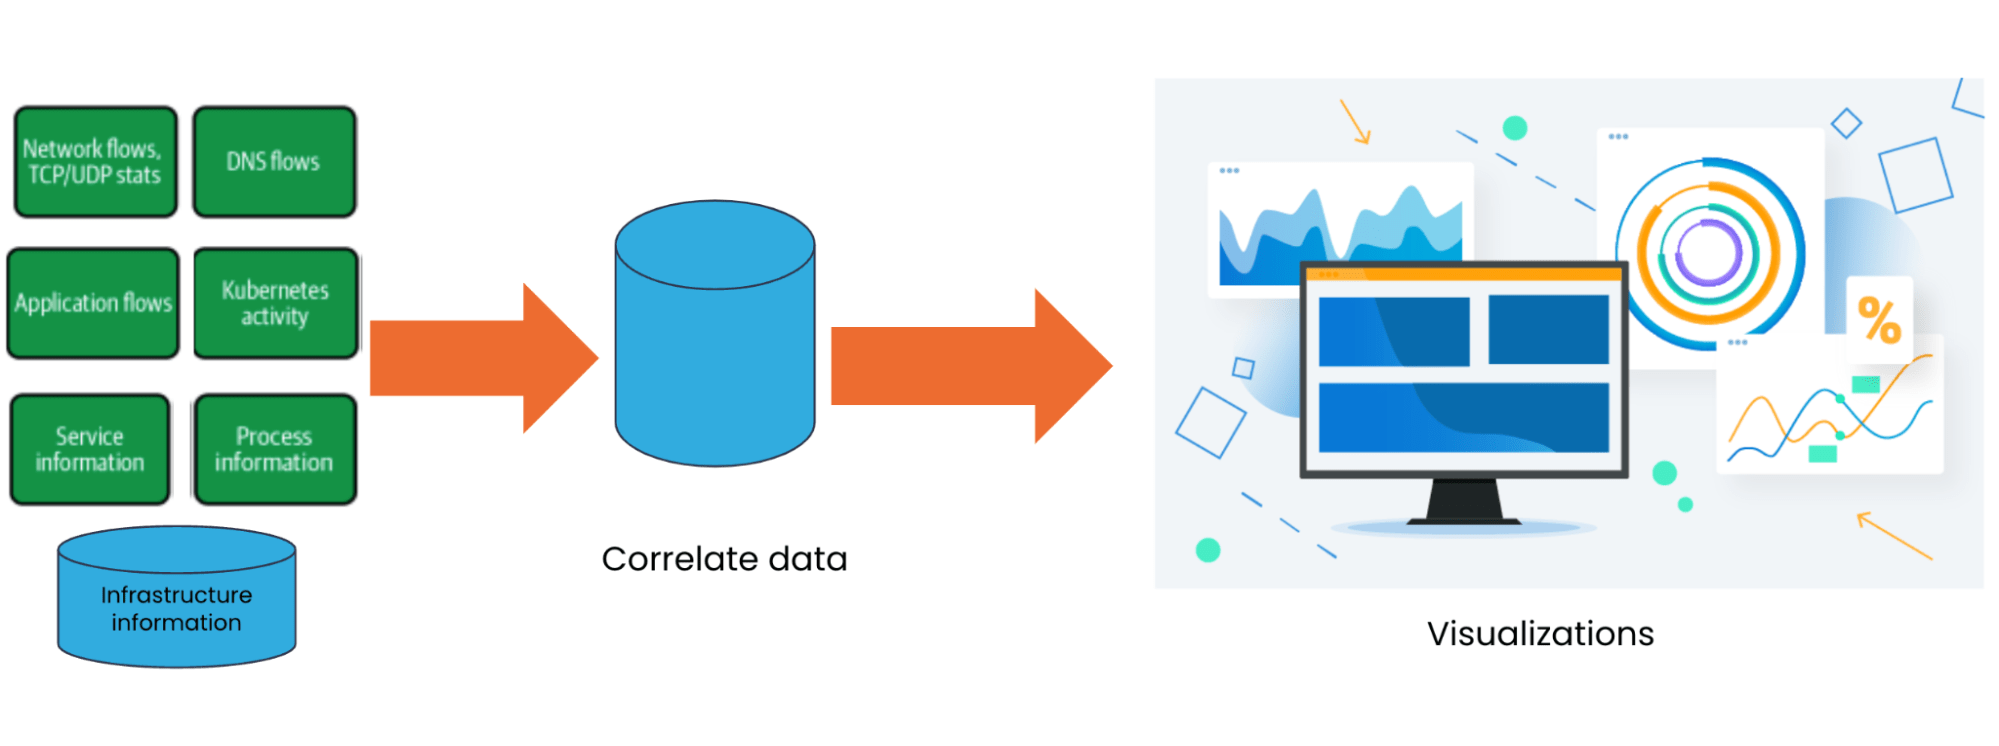
Calico automatically gathers logs from various activities within the Kubernetes cluster across the stack, such as DNS flows, application flows, microservice information, Kubernetes activity, audit logs, network flows, TCP/UDP status, socket stats, and process information. It also records data on various network policies applied within the clusters, such as application-level, network-level, and DNS policies. Calico combines all these datapoints at the source, enriching it with Kubernetes-specific metadata without any additional configuration required, thus saving time, effort, and resources such as memory, compute, and network bandwidth.
Visualizations
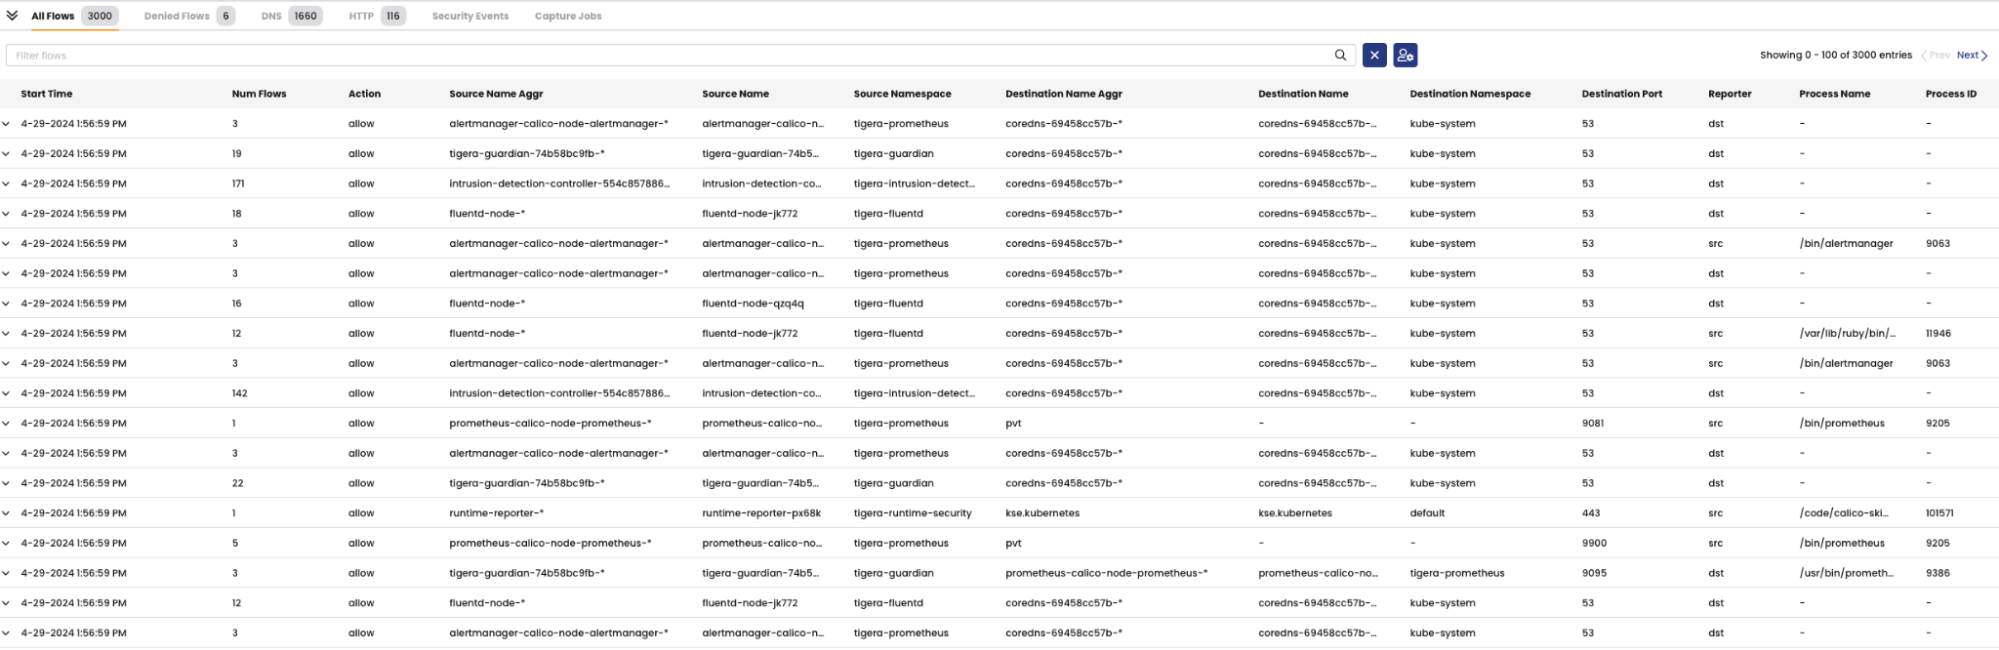
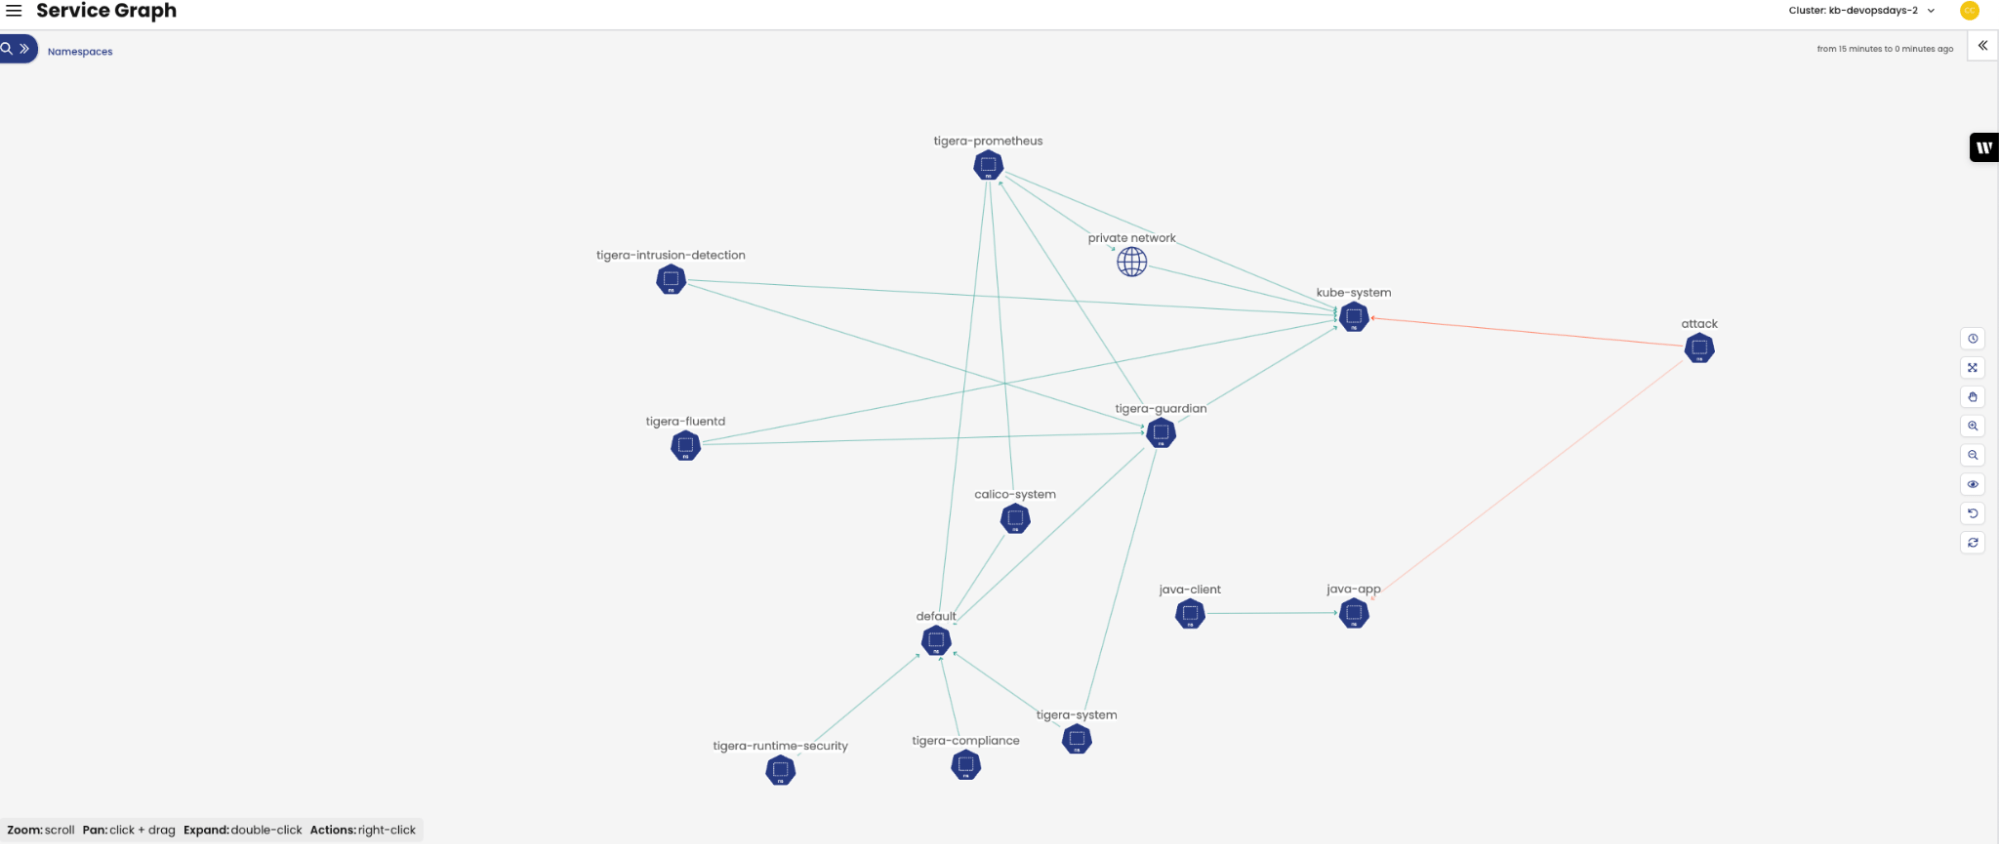
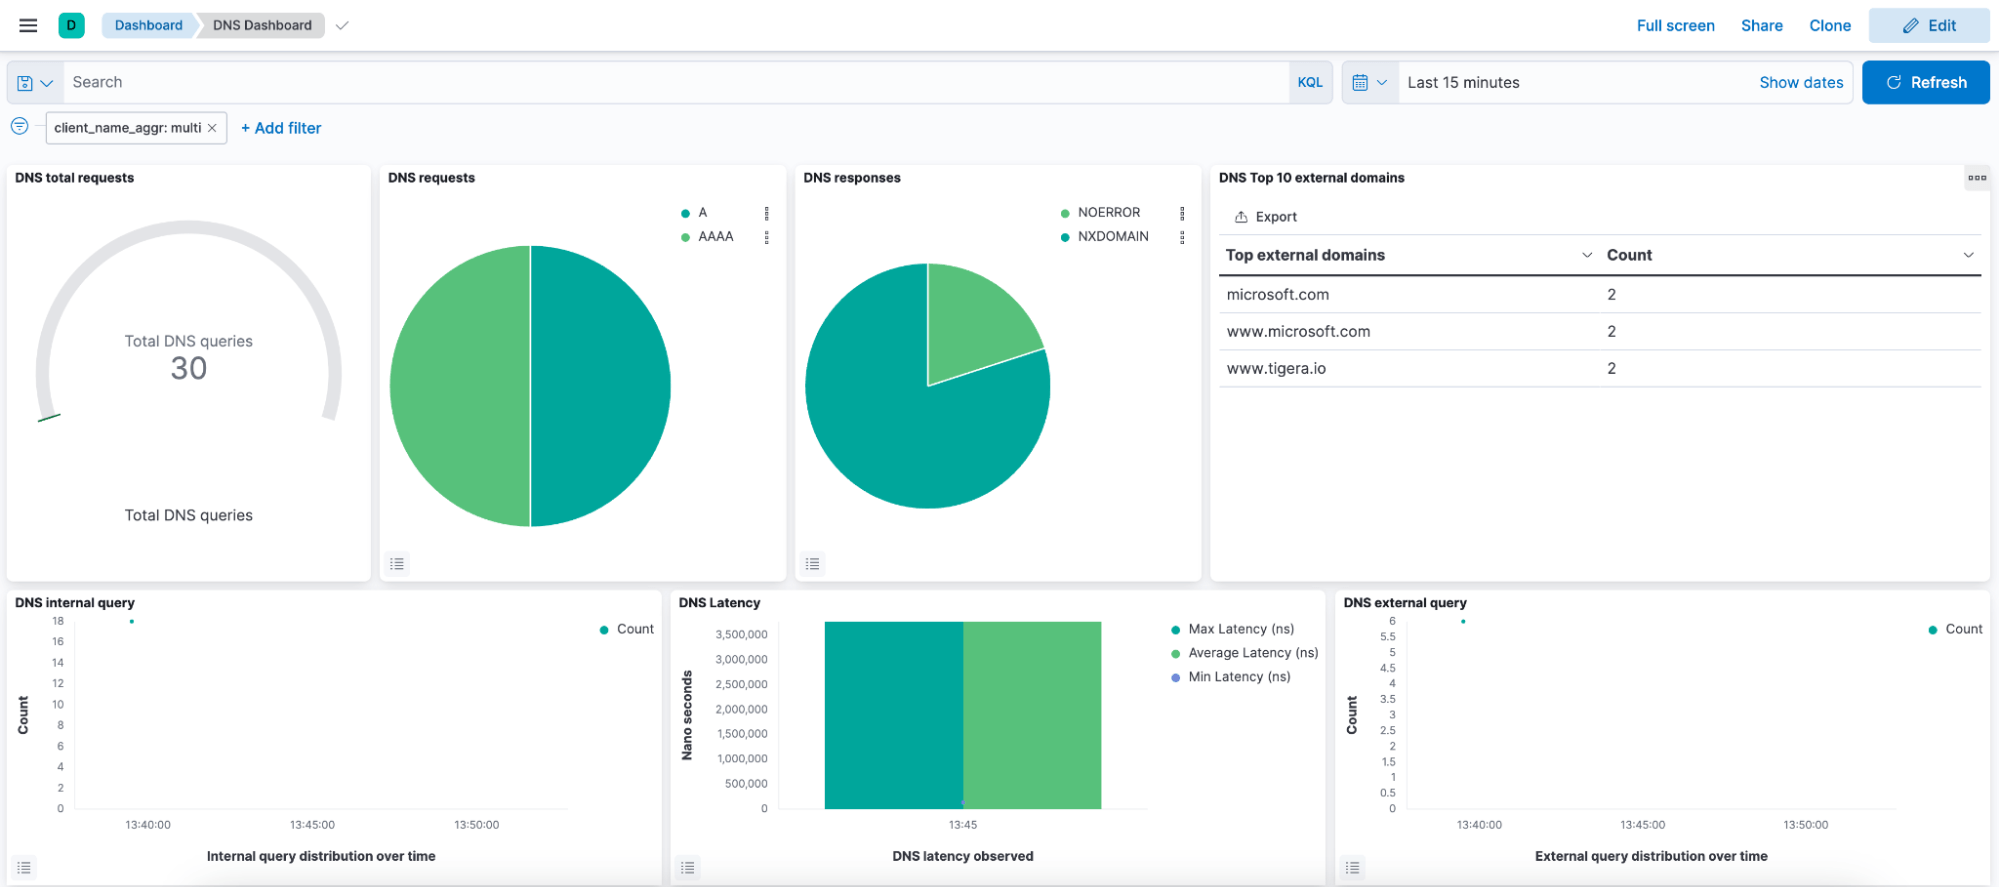
Calico Cloud offers a detailed dashboard for easy monitoring of traffic flow, and network policies, and troubleshooting networking and network security issues with Dynamic Service Threat Graph. It also provides custom dashboards such as the DNS Dashboard for in-depth insights into application networking and security. Additionally, Calico features advanced log management with automated filtering and pre-built tabs to streamline troubleshooting and do faster root-cause analysis. Calico makes identifying problematic workloads and quickly accessing the relevant logs straightforward, significantly simplifying the troubleshooting process.
For users seeking deeper analysis such as DNS analysis, the built-in integration with Kibana allows for the creation of detailed and custom queries, catering to more advanced needs.
Troubleshooting tools
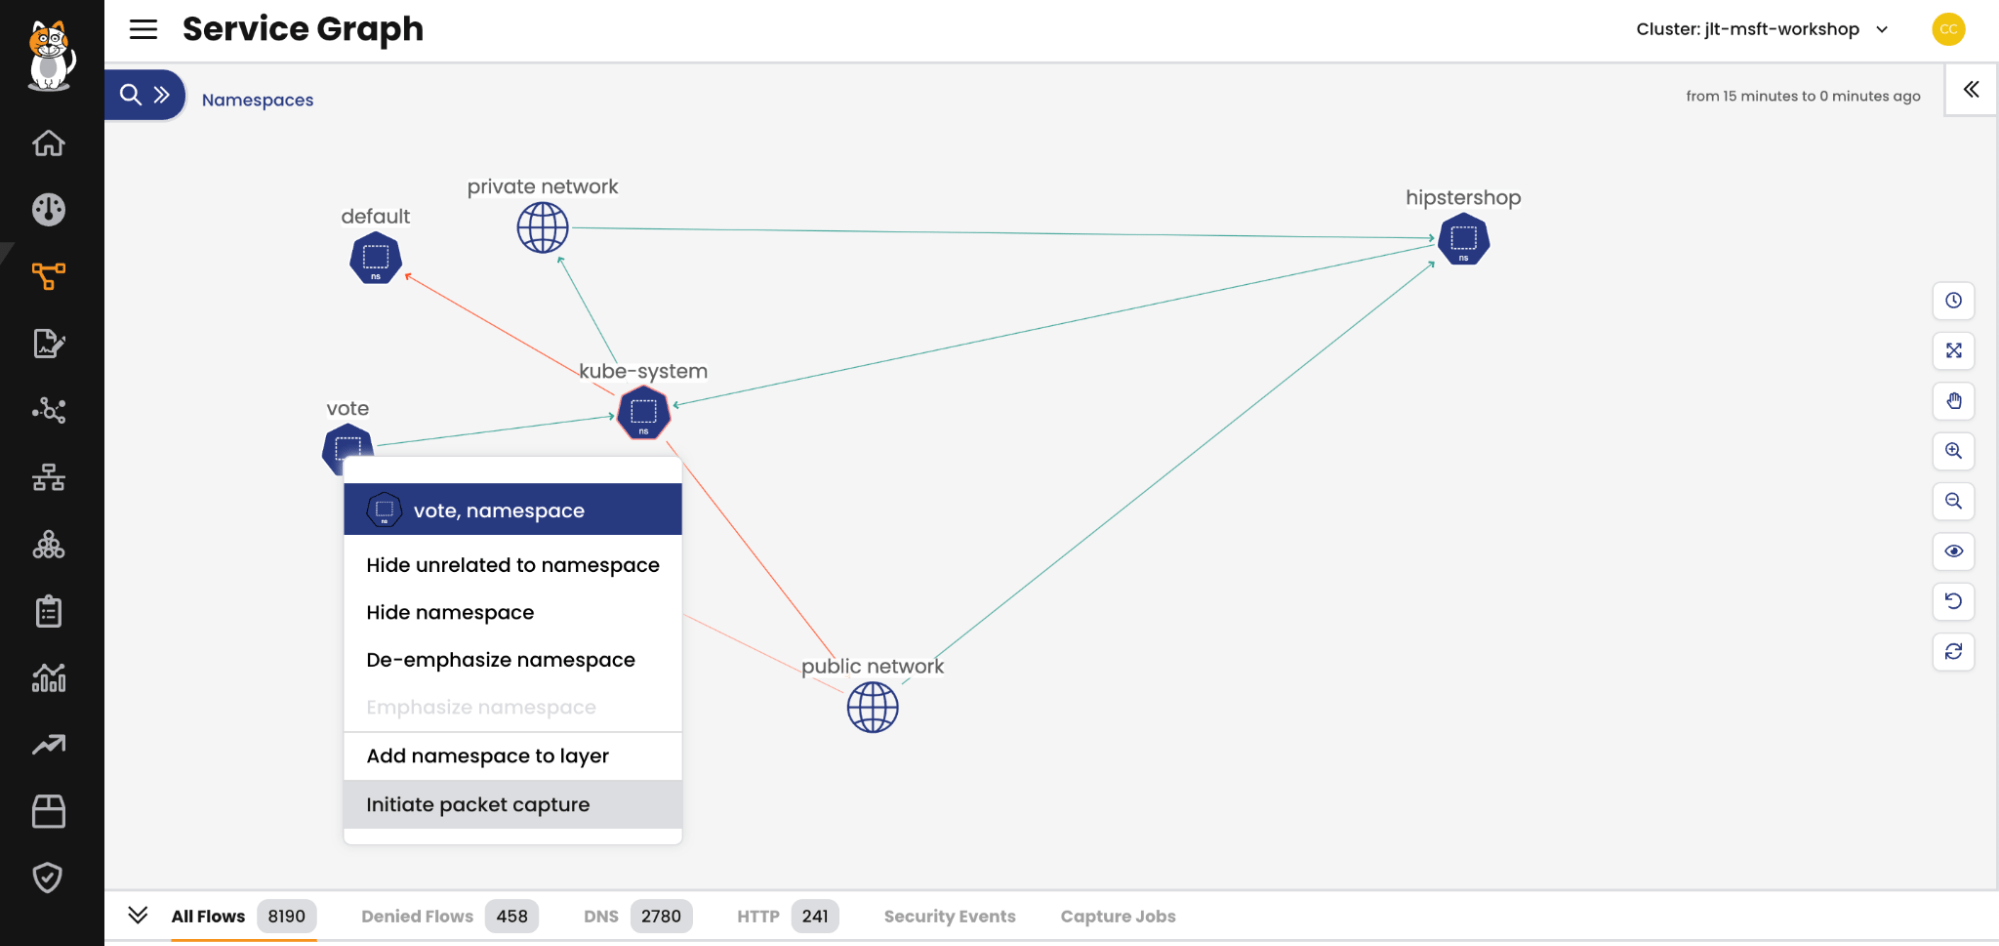
Calico provides tools to troubleshoot network connectivity issues. Consider a scenario where a dashboard alerts to a communication breakdown or a policy denying traffic. In the figure below, DevOps and platform engineers can troubleshoot why the ‘default’ pod is not communicating with Kube-system in just a few clicks. A user navigates to the service graph, right-clicks on the pod, enables packet capture with specific timestamps and protocols, and captures all traffic to do root-cause analysis. The captured data is already aggregated, and correlated, and points to specific configurations, dependencies, or policies for breakdown. By selecting the affected workloads, the user can immediately see what is causing the network breakdown, including network policies causing the problem.
Benefits of using Calico
- Faster Troubleshooting: By offering a real-time view of application traffic and correlated data, Calico enables DevOps teams to quickly narrow down troubleshooting efforts—from misconfigured network policies to networking performance issues. This streamlined approach allows teams to efficiently address security gaps and workload communication issues, thereby reducing downtime and boosting operational efficiency.
- Improved Security Posture: DevOps teams can now pinpoint security gaps and address the lack of granular workload access controls using Calico. With activity-based visualizations and detailed traffic metadata, Calico enables teams to preview and recommend policies before enforcement. This enhances an application’s security posture and effectively mitigates risks.
Conclusion
Calico empowers DevOps and platform teams to achieve observability and efficient troubleshooting for their container and Kubernetes environments. By providing a purpose-built solution that addresses the limitations of current approaches, Calico enables teams to reduce downtime, improve security posture, and enhance operational efficiency. With Calico, DevOps and platform teams can confidently navigate the complexities of container and Kubernetes environments and drive innovation with peace of mind.
Ready to try Calico for yourself? Sign up for a free trial of Calico Cloud.